The German PostgreSQL Conference (PGConf.DE) took place for the tenth time this year. The anniversary edition was hosted on April 21 and 22, 2026, at Haus der Technik in Essen. With more than 308 registrations, this was one of the larger events in this series and underscores the continuously growing development of the PostgreSQL community in German-speaking countries. Each year, the conference brings together developers, administrators, and decision-makers and serves as a central platform for professional exchange, networking, and up-to-date insights into the ongoing development of PostgreSQL. (more…)
CERN PGDay 2026 took place on Friday, February 6, 2026, at CERN campus in Geneva, Switzerland. This was the second annual PostgreSQL Day at CERN, co-organized by CERN and the Swiss PostgreSQL Users Group. The conference offered a single-track schedule of seven sessions (all in English), followed by an on-site social event for further networking in the inspiring environment of CERN. With around 100 participants, this is already a very large PostgreSQL event for Switzerland. But what made this event absolutely special was its location. Hosting a database conference at CERN – one of the world’s leading science laboratories – provided a unique experience for everyone.
Mönchengladbach (DE) / Naarden (NL) — February 4th, 2026
Splendid Data and credativ GmbH announce strategic partnership to accelerate Oracle-to-PostgreSQL migration for enterprises.

Splendid Data and credativ GmbH today announced a strategic partnership to help organisations modernize complex Oracle database environments by migrating to native PostgreSQL in a predictable, scalable and future-proof manner.
The partnership addresses growing enterprise demand to reduce escalating database licensing costs while regaining autonomy, ensuring digital sovereignty and preparing data platforms for AI-driven use cases. PostgreSQL is increasingly selected as a strategic database foundation due to its open architecture, strong ecosystem and suitability for modern, data-intensive workloads.
Splendid Data contributes its Cortex automation platform, designed to industrialize large-scale Oracle-to-PostgreSQL migrations and reduce risk across complex database estates. credativ adds deep PostgreSQL expertise, enterprise-grade platform delivery and 24×7 operational support for mission-critical environments. Together, the partners also align on PostgresPURE, a production-grade, pure open-source PostgreSQL platform without proprietary extensions or vendor lock-in.
“Enterprises are making long-term decisions about licensing exposure, autonomy and AI readiness,” said Michel Schöpgens, CEO of Splendid Data. “This partnership combines migration automation with trusted PostgreSQL operations.”
David Brauner, Managing Director at credativ, added: “Together we enable customers to modernize faster while maintaining control, transparency and operational reliability.”
The initial geographic focus of the partnership is Germany, where credativ has a strong customer base. The model is designed to scale toward international enterprise customers over time. Joint activities will include coordinated go-to-market efforts, enablement of credativ teams on Cortex, and the delivery of initial pilot projects with shared customers.
Both companies view the partnership as a long-term collaboration aimed at setting a new standard for large-scale, open-source database modernization in Europe.
About credativ
credativ GmbH is an independent consulting and service company focusing on open source software. Following the spin-off from NetApp in spring 2025, credativ combines decades of community expertise with professional enterprise standards to make IT infrastructures secure, sovereign and future-proof, without losing the connection to its history of around 25 years of work in and with the open source community.
About Splendid Data
Splendid Data is a PostgreSQL specialist focused on large-scale Oracle-to-PostgreSQL migrations for enterprises with complex database estates. Its Cortex platform enables automated, repeatable migrations, while PostgresPURE provides a production-grade, open-source PostgreSQL platform without vendor lock-in.
Contact credativ:
Peter Dreuw, Head of Sales & Marketing (peter.dreuw@credativ.de)
Contact Splendid Data:
Michel Schöpgens, CEO (michel.schopgens@splendiddata.com)
Securing PostgreSQL databases correctly requires a multi-layered approach with robust authentication procedures, regular backups, and continuous monitoring. Effective security combines transport- and storage-level encryption with strict access controls and proactive monitoring. This comprehensive guide answers the most important questions regarding PostgreSQL security for enterprises.
What are the greatest security risks for PostgreSQL databases?
The greatest security risks for PostgreSQL databases include weak authentication, unencrypted data transmission, poorly configured access rights, and missing security updates. Additionally, SQL injection attacks, unsecured network connections, and insufficient monitoring pose serious threats.
Unzureichende Authentifizierung entsteht häufig durch schwache Passwort-Richtlinien oder die Verwendung von Standard-Anmeldedaten. Viele Installationen verwenden noch immer einfache Passwörter oder lassen Benutzerkonten ohne angemessene Berechtigung zu. This gives attackers direct access to sensitive company data. PostgreSQL 18 already offers modern and secure options for user authentication with OAuth2.
A lack of encryption during data transmission allows attackers to intercept communication between applications and the database, as login credentials and business data are transmitted in plain text without SSL/TLS encryption. Today, unencrypted data transmission is a clear no-go in the vast majority of scenarios, even in-house. When working in a cloud environment in the broadest sense—including the use of hosting or service providers—strong transport layer encryption is an absolute must-have. At the same time, unencrypted data storage jeopardizes security in the event of physical access to servers.
Missing or incorrect adjustments to the pg_hba.conf file lead to unintended or more extensive access than intended. This is less about permissions for data within the database and more about the ability to connect to the database at all. Additionally, permissions for the actual data within the database are often configured more broadly than necessary, partly due to convenience or historical reasons. These potential problems are further exacerbated by outdated PostgreSQL versions without current security patches.
How to set up secure authentication and access control?
Unfortunately, a common pattern in applications today is still the fact that the software uses only one generic database user, which often receives more rights in the database than it actually needs. Especially with pre-installed systems, this user is configured with publicly known default passwords. This has nothing to do with security.
Note: In practice, the database user is often set up universally to avoid running into connection limits and/or to benefit from connection pooling and similar techniques.
Fundamentally, permissions (authorization) should be handled as little as possible within the application and instead by the database. This allows the application to save a lot of code and only react to denied access. The opposite is "common" today, which undermines effective data protection.
Secure PostgreSQL authentication is based on strong password policies, role-based access controls, and the principle of least privilege. Configure the pg_hba.conf file restrictively and implement multi-factor authentication for administrative access. Every user should only receive the minimum necessary rights.
Start by creating specific database roles for different application areas. Use CREATE ROLE commands to define function-specific roles. For example, reporting applications only require read access, while backup processes require special system rights. Avoid using the superuser account for routine operations.
The pg_hba.conf file controls client authentication and connection methods. Configure this file to allow only specific IP addresses and subnets. Use scram-sha-256 instead of md5 and forbid trust for production environments. Restrict local connections to necessary system users.
Implement strong password policies with extensions such as passwordcheck to enforce complex passwords. Regular auditing and the deactivation of unused roles further increase security.
In contrast, password rotations have been proven not to help with passwords that a human must enter. Here, the BSI and also the NIST have spoken out against regular rotation in current guidelines. It is clearly recommended to rely on other systems such as passkeys via OAuth2, two-factor authentication, or cryptographically secure passwords and passphrases.
For automatically generated, short-lived access to connect automations, for example, it is also possible to create temporary users with associated passwords via Hashicorp Vault and the "PostgreSQL database secrets engine". In this case, the permissions and availability of the accounts are defined in the Vault and are only created as needed and automatically removed again. This technique is often seen particularly in Kubernetes environments. Our Cloud Infra Team will be happy to advise you on this.
Which backup strategies guarantee full data recovery?
Full PostgreSQL data recovery requires at least logical, but ideally physical backups with continuous archiving of Write-Ahead Logs (WAL). Implement automated daily full backups, supplemented by continuous WAL archiving for Point-in-Time Recovery. Test recovery procedures regularly in isolated environments.
When backing up PostgreSQL databases, the 3-2-1 rule generally applies as always. This means that you create 3 copies on 2 different media, with 1 of them being an offsite backup. It is a fatal error if the backup and the database are on the same medium. Such a setup would be a feast for a ransomware attack. Fundamentally, backup media should either not be permanently available on the network or so-called "immutable" backup media should be used—storage media that can only be written to once. This does not necessarily mean optical storage; organizational locks such as an S3 Object Lock are also a viable solution. There are good approaches to solving this through open-source software, but manufacturers of high-quality storage solutions like NetApp also have corresponding offerings.
Backups should also not be performed without integration into monitoring. At the very least, it should be monitored that backups can be carried out as configured. However, a backup that runs "successfully" but afterwards contains only 0 to less than 100 bytes is worthless. Regular restore tests then confirm this status through spot checks.
Backup Methods
Logical backups with pg_dump are excellent for simple data backup and recovery as well as cross-platform compatibility. This method creates SQL commands to reconstruct database structures and content. For large databases, pg_dump offers parallel processing via the --jobs parameter, which can significantly reduce backup times depending on the database structure. It also makes it easy to back up an entire instance, individual databases, only schema data, or only content. However, it also applies that the restore is performed by executing the individual SQL commands. This can take a lot of time, again depending on the structure and size of the database.
Physical backups via pg_basebackup copy the entire database cluster structure at the file system level. This method allows for faster recovery of large databases and supports continuous archiving. However, there is no option to select which data should be backed up. The entire instance, including index data and other binary data in the data directory, is always included.
Combine base backups with WAL archiving for the option of Point-in-Time Recovery, which enables restores accurate to the second. Base backups can also check the integrity of the backed-up data using checksums. However, this only works if the respective instance has been initialized accordingly.
Continuous archiving of WAL files ensures minimal data loss in the event of system failures. Configure archive_mode and archive_command in the postgresql.conf for automatic WAL transfer to secure storage locations. Monitor archiving processes continuously and implement alerts for errors or delays. If you still have a recovery.conf file described in your environment's documentation, it may be worth having the installation and documentation checked by experts. This file was part of PostgreSQL up to and including PostgreSQL 11 and was merged into the postgresql.conf with PostgreSQL 12.
Another method would be the use of pgBackRest. This is a mature backup and restore framework for PostgreSQL that excels over built-in tools, especially with large clusters. This system can also implement compliance with RPO/RTO requirements. It supports full, differential, and incremental backups, parallelization, block-level delta, WAL archiving, encryption, compression (zstd/lz4), integrity checks, and remote/cloud repositories (e.g., S3, Azure Blob, GCS).
In Kubernetes environments, operators such as CloudNativePG or the Zalando Postgres Operator are often used today. These also use tools like Wal-E or Barman Cloud for backup and recovery and already provide high levels of integration and monitoring.
How to encrypt PostgreSQL data correctly?
PostgreSQL data encryption occurs on three levels: transport encryption with SSL/TLS for network connections, encryption of data at rest at the storage level, and field-based encryption for particularly sensitive information. Configure SSL certificates for secure client-server communication and use file system or partition encryption, such as LUKS, for database files.
SSL/TLS transport encryption protects data during transmission between clients and servers. Enable SSL by setting ssl = on in the postgresql.conf and configure the corresponding certificate files. Use self-signed certificates for development environments and CA-signed certificates for production systems. The pg_hba.conf should mandate hostssl connections for critical applications.
Encryption of data at rest typically occurs at the file system or storage level using tools like LUKS on Linux, BitLocker on Windows, or cloud provider encryption. PostgreSQL itself does not offer integrated encryption for database files without add-ons; therefore, implement encryption below the database layer. This protects against physical access to storage media and data theft in the event of server compromise.
Feldbasierte Verschlüsselung für hochsensible Daten bietet z.B. die PostgreSQL-Erweiterungen pgcrypto. Diese Extension bietet Funktionen für symmetrische und asymmetrische Verschlüsselung einzelner Datenbankfelder. Use these for payment data, personal identifiers, or trade secrets, keeping in mind the impact on performance during search and sort operations. pgcrypto also provides support for various other cryptographic operations such as hashing or salting.
Which monitoring tools detect security incidents early?
Effective PostgreSQL security monitoring combines integrated logging functions with specialized monitoring tools for anomaly detection. Enable detailed logging in the postgresql.conf and use tools like pgAudit for comprehensive audit logging. Implement automated alerting systems for suspicious activities and performance anomalies.
PostgreSQL's integrated logging functions offer comprehensive monitoring capabilities by configuring the log_* parameters. Enable log_connections, log_disconnections, and log_statement for detailed connection and query logging. The log_line_prefix configuration should include timestamps, users, databases, and process IDs to enable effective forensic analysis.
Specialized tools like pgAudit extend standard logging functions with granular audit trails for compliance requirements. This extension logs database access at the object and role level and allows for the tracking of data modifications. Combine pgAudit with log_statement_stats for performance monitoring and the detection of resource-intensive attacks.
Automated monitoring systems such as Prometheus with PostgreSQL Exporter or specialized database monitoring tools detect anomalies in real time. Monitor metrics such as connection count, query performance, memory consumption, and unusual access patterns. Implement threshold-based alerts for critical events such as failed authentication attempts or unexpected database access outside of business hours.
Please note, however, that with every expansion of logging, the requirements for storage in terms of performance and especially space requirements also increase. Therefore, check very carefully which configurations are essential for you in production and which only offer added value in the development environment, for example. We are happy to support and advise you here.
How to perform regular security updates and maintenance?
Regular PostgreSQL security maintenance includes systematic update cycles, continuous vulnerability assessments, and proactive configuration reviews. Establish monthly minor updates for patches and plan major updates annually after thorough testing. PostgreSQL also has a relatively stable and well-documented release cycle, which makes the work easy to plan even months in advance.
Security patches for PostgreSQL are released regularly and address critical vulnerabilities. Subscribe to the PostgreSQL Announce mailing list for timely notifications about available minor updates and check the updates of the repositories you use for the corresponding packages. Test patches first in development and staging environments before implementing them in production systems. Use maintenance windows for planned updates and have rollback strategies ready.
Continuous configuration reviews identify security gaps caused by changing requirements or configuration drift. If possible, use automation such as Ansible or similar systems to ensure the desired state and to detect local deviations. Alternatively, at the very least, configuration files should be maintained and monitored with version control. Tools for optimizing configuration in terms of performance and security are available but should be used with appropriate caution, as most systems have individual requirements.
Comprehensive security audits should include quarterly external penetration tests, vulnerability scans, and compliance reviews. Professional PostgreSQL support can help meet complex security requirements and optimally protect critical systems. Conduct regular disaster recovery tests and update incident response plans based on new threat situations and business requirements.
How credativ helps with PostgreSQL security
credativ offers comprehensive PostgreSQL security solutions that cover all critical aspects of database protection. Our experts support you in implementing robust security strategies and ensure the optimal protection of your corporate data:
• Security audits and penetration tests: Comprehensive analysis of your PostgreSQL infrastructure to identify vulnerabilities and compliance gaps
• Backup and recovery strategies: Development and implementation of tailored backup concepts with automated monitoring and regular recovery tests
• Encryption implementation: Configuration of SSL/TLS, file system encryption, and column-based encryption according to industry standards
• Monitoring and alerting: Setup of professional monitoring systems with 24/7 support for critical security incidents
• Compliance support: Consulting on meeting GDPR, ISO 27001, and industry-specific security requirements
Secure your PostgreSQL databases with professional expertise. Contact us for an initial consultation and find out how we can optimally protect your database infrastructure.
Securing PostgreSQL databases requires a systematic approach with multiple layers of protection. By implementing robust authentication, comprehensive backup strategies, and continuous monitoring, you create a solid foundation for protecting your corporate data. Regular maintenance and proactive security measures ensure secure and reliable database operations in the long term.
PostgreSQL is an important building block for digital sovereignty. But even this building block requires a little effort and attention to be used effectively. We are happy to support you in the implementation as well as in the training of your IT team.
We are also happy to advise you on other topics related to Linux hardening, for example using AppArmor.
PostgreSQL offers various data types for the structured storage of different information in databases. The most important categories include numeric data types (INTEGER, BIGINT, DECIMAL), string data types (VARCHAR, TEXT), date and time data types (TIMESTAMP, DATE), and special data types such as JSON, BOOLEAN, and ARRAY. The correct selection significantly optimizes storage space and query performance.
What are PostgreSQL data types and why are they important?
PostgreSQL data types define what kind of data can be stored in a column and how that data is interpreted. They determine storage requirements, validation rules, and the available operations for each data value. Correctly selecting data types is crucial for database performance and data integrity.
Data types optimize storage space by precisely defining the required storage capacity. For example, an INTEGER requires 4 bytes, while a BIGINT uses 8 bytes. With millions of records, this difference has a significant impact on memory usage and query speed.
PostgreSQL organizes data types into various categories: numeric types for numbers, string types for text, date and time types for temporal data, and advanced types such as JSON, arrays, and geometric data structures. Each category offers specific functions and optimizations for different use cases.
Which numeric data types does PostgreSQL offer?
PostgreSQL provides several numeric data types: INTEGER, BIGINT, SMALLINT for integers, as well as DECIMAL, NUMERIC, REAL, and DOUBLE PRECISION for floating-point numbers. Integer data types differ in their value range and storage requirements, while floating-point types offer different levels of precision.
SMALLINT uses 2 bytes and stores values from -32,768 to 32,767. INTEGER requires 4 bytes for values between -2,147,483,648 and 2,147,483,647. BIGINT uses 8 bytes and supports extremely large numbers up to 9,223,372,036,854,775,807.
For decimal numbers, DECIMAL (synonymous with NUMERIC) offers exact precision without rounding errors, making it ideal for financial calculations. REAL uses 4 bytes for single floating-point precision, while DOUBLE PRECISION uses 8 bytes for double precision. In PostgreSQL development, the choice between exact and approximate arithmetic is crucial for data quality.
How do text and string data types work in PostgreSQL?
PostgreSQL offers four main types for text data: CHAR for fixed length, VARCHAR for variable length with a maximum, TEXT for unlimited length, and CITEXT for case-insensitive comparisons. VARCHAR and TEXT are the most commonly used options for most applications.
CHAR(n) always reserves n characters of storage space and pads shorter values with spaces. VARCHAR(n) stores only the characters actually used plus one byte for length information. TEXT has no length limit and offers maximum flexibility for large amounts of text.
Performance considerations show that VARCHAR and TEXT offer virtually identical performance. PostgreSQL optimizes both types equally efficiently. The choice between VARCHAR with a length limit and TEXT without a limit depends on validation requirements. PostgreSQL fully supports Unicode (UTF-8) and enables international character sets without additional configuration.
Which date and time data types are available in PostgreSQL?
PostgreSQL provides five temporal data types: DATE for calendar dates, TIME for times of day, TIMESTAMP for date and time, TIMESTAMPTZ for timezone-aware timestamps, and INTERVAL for time spans. TIMESTAMPTZ is recommended for most applications as it correctly manages time zones.
DATE stores only calendar dates without time information (YYYY-MM-DD). TIME records times of day with optional microsecond precision. TIMESTAMP combines both without a time zone reference, while TIMESTAMPTZ stores timestamps in UTC and converts them to the session time zone during queries.
INTERVAL allows calculations with time spans such as “3 months 2 days 14 hours”. PostgreSQL offers extensive functions for date arithmetic, formatting, and time zone conversion. Best practices recommend the consistent use of TIMESTAMPTZ for all time-related data in international applications.
What are special PostgreSQL data types and when should they be used?
PostgreSQL offers advanced data types for modern application requirements: BOOLEAN for truth values, UUID for unique identifiers, JSON/JSONB for structured documents, ARRAY for lists, and geometric types for spatial data. JSONB and ARRAY enable flexible data structures without separate tables.
BOOLEAN efficiently stores the truth values true, false, or null. UUID generates globally unique 128-bit identifiers, ideal for distributed systems. JSON stores documents as text, while JSONB provides a binary, indexable version with better performance.
ARRAY allows the storage of multiple values of the same type in a single column, for example, INTEGER[] for lists of numbers. Geometric types such as POINT, LINE, and POLYGON support spatial applications. These advanced data types integrate seamlessly into modern application architectures and reduce the complexity of data models through native support for complex structures.
How credativ® helps with the optimal use of PostgreSQL data types
credativ® supports companies in the strategic selection and implementation of the right PostgreSQL data types for maximum performance and data integrity. Our PostgreSQL solutions analyze your specific requirements and develop customized database structures:
- Performance Analysis: Evaluation of existing data structures and identification of optimization potential
- Data Modeling: Development of efficient schemas with optimally chosen data types
- Migration and Modernization: Secure transition of legacy data structures into modern PostgreSQL implementations
- Training and Consulting: Knowledge transfer for your development teams on best practices for data types
- 24/7 Support: Continuous support and optimization of your PostgreSQL environments
Contact us for a free initial consultation and find out how the right data type strategy can revolutionize your database performance.
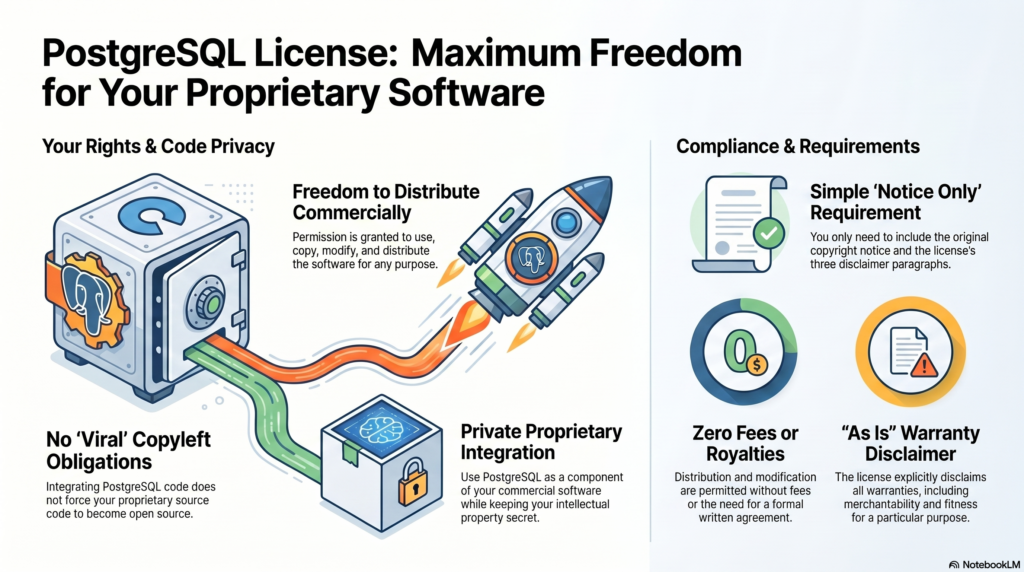
PostgreSQL® uses a permissive open-source license known as the PostgreSQL License. It is based on the BSD license and allows both commercial and non-commercial use without restrictions. Companies can use, modify, and redistribute PostgreSQL free of charge, and only need to retain the original copyright notice.
What is the PostgreSQL License, and why is it so popular?
The PostgreSQL License is a BSD-like open-source license that grants maximum freedom in using the database. It was specifically designed to offer both developers and companies the greatest possible flexibility, without the legal complexities of other licensing models.
This license is particularly popular with companies because it contains no copyleft provisions. This means you can integrate PostgreSQL into proprietary software without having to disclose your own application’s source code. The license dates back to 1996 and has since established itself as a stable, trusted licensing model.
The core characteristics make PostgreSQL attractive for commercial projects: no license fees, no limits on the number of users or installations, and full control over modifications. Companies particularly value the legal certainty and the ability to use PostgreSQL without long-term contractual commitments.
What rights and obligations do companies have when using PostgreSQL?
Specifically, the rights include: unlimited commercial use in any line of business, modification of the source code to meet your requirements, redistribution of both the original and modified versions, and integration into closed, proprietary software solutions without any disclosure obligation.
With PostgreSQL, companies receive extensive usage rights with no significant restrictions. They may use the database commercially, modify the source code, create their own versions, and even sell them. Integration into proprietary software is explicitly permitted.
The obligations are minimal and limited to a few points: the original copyright notice must remain included in all copies or substantial portions of the software. In addition, you must respect the original developers’ disclaimer of liability. Attribution in documentation or About dialogs is not mandatory, but it is appreciated.
- Unlimited use: Commercially in any line of business.
- Modification: Source code may be adapted as desired.
- Redistribution: Including in closed, proprietary products.
How does PostgreSQL differ from other database licenses?
PostgreSQL differs significantly from other database licensing models due to its permissive structure. While MySQL® is licensed under the GPL, Oracle® uses proprietary licenses, and MongoDB® introduced the restrictive SSPL, PostgreSQL remains consistently open and business-friendly.
The comparison shows clear differences: MySQL under the GPL often requires paid licenses for commercial use in proprietary software. Oracle Database generally requires license fees and offers only limited free versions. With the SSPL, MongoDB introduced a license that obliges cloud providers to disclose their entire service software.
For companies, PostgreSQL offers clear advantages: no licensing costs, no legal pitfalls when integrating into commercial products, and no obligation to disclose proprietary developments. PostgreSQL support is also available from various providers, without vendor lock-in effects.
The PostgreSQL License is compatible with almost all other open-source licenses. For example, PostgreSQL code can be incorporated into a GPL-licensed project without any issues.
Comparison of the GNU General Public License (GPL), the GNU Affero General Public License (AGPL), and the PostgreSQL License.
This table highlights, in particular, the differences in the obligation to disclose source code, which is crucial for commercial use and proprietary software development:
| Feature | GPL (v2 / v3) | AGPL (v3) | PostgreSQL License |
|---|---|---|---|
| License type | Strong copyleft (“viral effect”) | Strong copyleft (“viral effect”) | Permissive (liberal) |
| Source code disclosure upon distribution/redistribution | Yes. If derivative works (or combinations) are distributed, the entire source code must be disclosed under the GPL | Yes. As with the GPL, the source code must be disclosed upon redistribution | No. There is no obligation to disclose your own source code |
| Source code disclosure for network / SaaS use (ASP) | No. As long as the software is provided only over a network (without sending copies to the client), the source code does not have to be disclosed | Yes. The AGPL closes the so-called “ASP loophole.” Nutzer, die über ein Netzwerk mit der Software interagieren, müssen Zugang zum Quellcode erhalten | No. Source code does not have to be disclosed, neither upon redistribution nor for network use |
| Combination with proprietary software (business advantage) | Not permitted/high risk. Proprietary systems may not integrate GPL code without themselves being placed entirely under the GPL (disclosure obligation) | Not permitted/high risk. Similar to the GPL, but with even stricter requirements for pure network use | Permitted. The software may be used, copied, modified, and distributed for any purpose (including commercial) without license fees and without a written contract |
The key business advantage of the PostgreSQL License
As the table shows, the biggest difference lies in how derivative works are handled and in integration into proprietary software.
The GPL and AGPL are strong copyleft licenses. This means: If you integrate software (such as a GPL-licensed database) into your own software and distribute this combined solution, the “viral effect” applies. Your own software is legally considered an extended work of the GPL software and must also be released under the GPL (including disclosed source code). The AGPL goes even further and requires source code disclosure even if you only offer the modified database as a service (SaaS/cloud) over a network.
The PostgreSQL License, by contrast, is a very permissive license (similar to MIT or BSD). It explicitly grants permission to use, copy, modify, and distribute the software and its documentation for any purpose, without fees or a written contract. The only condition is that the copyright notice and the two paragraphs of the disclaimer remain included in all copies. For a company, this represents a major business advantage: you can easily integrate a PostgreSQL database into a commercial, closed (proprietary) software product and sell it without ever being forced to disclose your own product’s source code.
Please note that this information reflects only the current state of our research and does not constitute legal advice. For a specific assessment of a particular use case, we recommend seeking individual legal advice for the respective case and the relevant jurisdiction.
What should you consider when using PostgreSQL commercially?
When using PostgreSQL commercially, you should follow basic compliance rules to ensure legal certainty. Document PostgreSQL usage in your project, retain copyright notices, and establish internal policies for handling open-source components.
Practical guidelines for legally compliant use include: maintain a software inventory list of all open-source components used, ensure development teams are informed about licensing terms, and store all relevant license texts and copyright notices in a central repository.
To minimize risk, professional support is recommended, especially for business-critical applications. Regular updates and security patches should be planned. Professional PostgreSQL support can help you manage both technical and legal aspects optimally and fully leverage the benefits of the permissive license. For a legal assessment of the licensing situation, please consult your attorney.
Liability
The PostgreSQL License also includes a warranty disclaimer. The software is provided “AS IS”. In our view, recourse against the authors or the project in the event of an error is therefore largely excluded. For this reason, in a business environment you should always safeguard PostgreSQL operations through a qualified service provider, such as the PostgreSQL Competence Center of credativ GmbH. Depending on compliance requirements, this may even be mandatory.
How credativ® supports PostgreSQL implementation
As an ISO 9001 and ISO 27001 certified service provider, credativ® offers comprehensive consulting and support for the optimal use of PostgreSQL. Our expert team helps you fully leverage the benefits of the PostgreSQL License while meeting all compliance requirements.
Our services include:
- Compliance consulting: Integrating PostgreSQL into your commercial software
- Technical implementation: Professional PostgreSQL installation and configuration
- 24/7 support: Continuous support for your PostgreSQL environment
- Migration and updates: Secure data migration and regular updates
- Training: Upskilling your teams on PostgreSQL best practices
Contact us today for a free consultation and learn how you can use PostgreSQL optimally and securely in your company.
Transparency notice:
Oracle® and MySQL® are trademarks of Oracle Corp. MongoDB® is a trademark of MongoDB Inc. PostgreSQL® is a trademark of the PostgreSQL Association, Canada. The mention of these trademarks is solely for the factual description of migration scenarios and services provided by credativ GmbH. There is no business relationship with the trademark owners mentioned with regard to the products referenced.
PostgreSQL is an open-source object-relational database that has been under development since 1986. It is characterized by ACID compliance, high extensibility, and strong SQL support. Companies value PostgreSQL for its reliability, performance, and cost-free nature. This guide answers the most important questions about the installation, configuration, and use of PostgreSQL in a corporate environment.
What is PostgreSQL and why do so many companies use it?

PostgreSQL is an object-relational database management system that is available as free open-source software. The database originated from the POSTGRES project at the University of California and has been continuously developed since 1986. PostgreSQL supports both relational and non-relational data structures and is considered one of the most advanced open-source databases worldwide.
The main features of PostgreSQL include ACID compliance for transaction security, Multi-Version Concurrency Control (MVCC) for concurrent access, and comprehensive SQL support. The database software also offers advanced data types such as JSON, XML, and arrays, as well as the ability to define custom functions and data types.
Companies of various sizes rely on PostgreSQL because it offers a stable and scalable solution for complex applications. The active developer community ensures regular updates and security patches. In addition, the free license allows for use without license costs, which is particularly attractive for growing companies.
How does PostgreSQL differ from other databases like MySQL?
PostgreSQL and MySQL differ in several important areas, with both having their specific strengths. PostgreSQL offers advanced data types such as JSON, JSONB, arrays, and geometric types, while MySQL focuses on basic SQL data types. PostgreSQL often shows better performance with complex queries and joins, while MySQL is often faster with simple read operations.
Licensing also differs: PostgreSQL is under the PostgreSQL license, which is very permissive, similar to the BSD license. MySQL uses dual licensing with GPL for open-source projects and commercial licenses for proprietary software. This can be relevant when deciding on commercial applications.
- PostgreSQL is particularly suitable for applications with complex data structures, analytical workloads, and when strict ACID compliance is required. For example, PostgreSQL natively supports geo-data and operations on geometric structures with the PostGIS extension.
- MySQL is often chosen for web applications, content management systems, and situations where simple configuration and high read performance are paramount.
Both databases have strong communities and professional support available.
What advantages does PostgreSQL offer for companies?
PostgreSQL offers companies significant cost advantages through the open-source license, as there are no license fees. This also enables small and medium-sized enterprises to build a professional database infrastructure. The saved license costs can be invested in hardware, development, or professional support.
PostgreSQL’s security standards meet enterprise requirements with features such as Row-Level-Security, SSL encryption, and comprehensive authentication options. The database supports various compliance standards and offers detailed audit functions for regulated industries.
PostgreSQL scales both vertically and horizontally and grows with the demands of your company. Independence from individual manufacturers prevents vendor lock-in and gives you the flexibility to obtain support and services from various providers. The large community and open development model ensure continuous innovation and long-term availability.
How to install and configure PostgreSQL correctly? Simple example:
The PostgreSQL installation is done in different ways depending on the operating system. Under Ubuntu/Debian, for example, use the command sudo apt-get install postgresql postgresql-contrib. For Windows, download the official installer from postgresql.org. macOS users can install PostgreSQL via Homebrew with brew install postgresql.
After the installation, you must start the PostgreSQL service and create a database user. Under Linux, this is done with sudo systemctl start postgresql and sudo -u postgres createuser --interactive. The basic configuration is done via the files postgresql.conf for general settings and pg_hba.conf for authentication.
This means that you are ready for a test on most Linux distributions. For more demanding applications, you should of course make further considerations, such as whether you want to rely on the packages and versions supplied with the respective distribution or whether you want to concentrate on the packages from PostgreSQL.org. A performant database server also requires considerations regarding the underlying file system and its optimization.
For productive use, you should also make important security settings:
- Change the default password of the postgres user, if one has been assigned
- Configure SSL encryption for network connections
- Restrict access via
pg_hba.confto necessary IP ranges - Enable logging for audit purposes
- Set up regular backups
How credativ® supports PostgreSQL projects
credativ® offers comprehensive PostgreSQL support for companies that need professional support for their database infrastructure. Our service includes 24/7 support from experienced PostgreSQL specialists who are immediately available for critical problems. You get direct access to our German support team without detours via international call centers. We are happy to help you and support you in the selection of open-source tools.
Our PostgreSQL services in detail:
- Migration from other database systems to PostgreSQL
- Installation consulting and audit of an existing installation
- Performance optimization and tuning of existing installations
- High availability setups with replication and clustering
- Backup and recovery strategies for maximum data security
- Monitoring and proactive maintenance of your PostgreSQL environment
- Long Term Support, which gives you time to complete the upgrades.
As PostgreSQL experts with over 20 years of experience, we help you to exploit the full potential of your database. Contact us for a non-binding consultation on your PostgreSQL project and find out how we can optimize your database infrastructure.
 PostgreSQL 17 introduced streaming I/O – grouping multiple page reads into a single system call and using smarter posix_fadvise() hints. That alone gave up to ~30% faster sequential scans in some workloads, but it was still strictly synchronous: each backend process would issue a read and then sit there waiting for the kernel to return data before proceeding. Before PG17, PostgreSQL typically read one 8kB page at a time.
- Heap sequential scans, like plain SELECT and COPY operations that stream lots of data
- VACUUM on big tables and indexes
- ANALYZE sampling
- Bitmap heap scans
Autovacuum benefits from this change too, since its workers share the same VACUUM/ANALYZE code paths. Other operations still remain synchronous for now:
- B‑tree index scans / index‑only scans
- Recovery & replication
- All write operations INSERT, UPDATE, DELETE, WAL writes
- Small OLTP lookups that touch a single heap page
Future work is expected to widen coverage, especially index‑only scans and some write‑path optimizations.
Significant improvements for cloud volumes
Community benchmarks show that PostgreSQL 18 AIO significantly improves cold cache data reads in cloud setups with network‑attached storage where latency is high. AWS documentation states that average latency of Block Express volumes is “under 500 microseconds for 16 KiB I/O size”, when latency of General Purpose volumes can exceed 800 microseconds. Some articles suggest that under high load each physical block read from disk can cost around 1ms, while page processing in PostgreSQL is much cheaper. By combining many pages into one read, all these pages together now cost around 1ms. And by performing multiple reading requests at the same time in parallel, we effectively pay that 1ms latency just once per the whole batch.
Asynchronous I/O methods
The new subsystem can run in one of three modes, configured via io_method parameter with possible values “worker” (default), “io_uring“, and “sync“. We will cover how each works and then show how to monitor asynchronous I/O in our environment.
io_method = sync
This mode effectively turns AIO off. Reads are executed through the same AIO API but synchronously, using regular preadv or pwritev methods on the backend process that issued the I/O. This method does not use any extra shared memory and is intended mainly for regression testing or if we suspect AIO is misbehaving. It is also used internally as fall back to the synchronous I/O for operations which cannot use asynchronous I/O. PostgreSQL core functions issue an error, if some extension would try to force asynchronous I/O through AIO API when global io_method is set to “sync”. Available benchmarks show that this PostgreSQL 18 mode performs similarly to PostgreSQL 17’s streaming I/O.
io_method = io_uring (Linux only)
SELECT pg_config FROM pg_config() where pg_config::text ilike ’%liburing%’;
- Backends write requests via API into a submission ring in shared memory
- The kernel performs I/O asynchronously and writes results into a completion ring
- Completion ring content is consumed by the backend with fewer context switches
Execution still happens in the same process, like with the “sync” method, but it uses kernel worker threads for parallel processing. This typically shines on very fast NVMe SSDs.
However, io_uring Linux feature also has had a rough security history. It bypasses traditional syscall audit paths and therefore has been involved in a large share of Linux kernel exploits. Google reported that 60% of Linux kernel vulnerabilities in 2022 involved io_uring and some security tools were unable to uncover these types of attacks. Therefore some container environments disable io_uring entirely.
io_method = worker
This is the cross‑platform, “safe” implementation and the default in PostgreSQL 18. Mechanism is very similar to existing parallel query processing. The main difference is that background I/O workers are long‑lived independent processes created at server start, not short‑lived processes spawned per query.
- At server start, the postmaster creates a pool of I/O worker processes. Number is controlled by io_workers parameter with a default of 3. However, benchmarks suggest this number should be higher on many‑core machines, typically between ¼ and ½ of available CPU threads. Best value depends on workload and storage latency.
- Backends submit read requests into a shared memory submission queue. This submission queue is generally a ring buffer that multiple backends can write into concurrently. It contains only metadata about the request – handle indices, not full request record. There is only one submission queue for the entire cluster, not per database or per backend. The actual details of the request are stored in separate memory structure.
- Request is checked if it must be executed synchronously or can be handled asynchronously. Synchronous execution can also be chosen if the submission queue is full. This avoids problems with shared memory usage under extreme load. In case of synchronous execution, code uses path for “sync” method described above.
- Request submission in shared memory wakes up one I/O worker, which pops request and executes traditional blocking read() / pread() calls. If queue is still not empty, woken worker can wake up 2 additional workers to process it in parallel. Note in code mentions that this can be in the future extended to configurable N workers. This limit helps to avoid so called “thundering herd problem”, when single submitter would wake up too many workers causing havoc and locks for other backends.
- One limitation for asynchronous I/O is the fact, that workers cannot simply reuse file descriptors opened by backends, they must reopen files in their own context. If this is not possible for some types of operations, synchronous I/O path is used for that specific request.
- When workers finish a request without an error, they write data blocks into share buffers, put result into a completion queue and signal the backend.
- From the perspective of the backend, I/O becomes “asynchronous”, because the “waiting” happens in worker processes, not in the query process itself.
- Works on all supported OSes
- Simple error handling: if a worker crashes, requests are marked as failed, worker exits and a new worker is spawned by postmaster
- Avoids the security concerns around Linux io_uring interface
- The downside is extra context switches and possible shared‑memory queue contention, but for many workloads the ability to overlap reads easily pays for that
- This method improves performance even in the case when all blocks are just copied from local Linux memory cache, because it is now done in parallel
Tuning the New I/O Parameters
PostgreSQL 18 adds or updates several parameters related to disk I/O. We already covered io_method and io_workers; let’s look at the others. Another new parameters are io_combine_limit and io_max_combine_limit. They control how many data pages PostgreSQL groups into a single AIO request. Larger requests typically yield better throughput, but can also increase latency and memory usage. Values without units are interpreted in 8kB data blocks. With units (kB, MB), they directly represent size – however, should be multiples of 8kB.
Parameter io_max_combine_limit is a hard server‑start cap, io_combine_limit is the user‑tunable value that can be changed at runtime but cannot exceed the max. Default values of both is 128kB (16 data pages). But documentation recommends setting up to 1MB on Unix (128 data pages) and 128kB on Windows (16 data pages – due to limitations in internal Widows buffers). We can experiment with higher values, but based on HW and OS limits AIO benefits plateau after some chunk size; pushing this too high doesn’t help and can even increase latency.
PostgreSQL 18 introduces also io_max_concurrency setting, which controls max number of IOs that one process can execute simultaneously. Default setting -1 means value will be selected automatically based on other settings, but it cannot exceed 64.
Other related parameter is effective_io_concurrency – number of concurrent I/O operations that can be executed simultaneously on storage. Range of values is from 1 to 1000, value 0 disables asynchronous I/O requests. Default value is now 16, some community articles suggest to go up to 200 on modern SSDs. Best setting depends on specific hardware and OS, however, some articles also warn that too high value may significantly increase I/O latency for all queries.
How to Monitor Asynchronous I/O
pg_stat_activity
SELECT pid, backend_start, wait_event_type, wait_event, backend_type
FROM pg_stat_activity
WHERE backend_type = 'io worker';


  pid |        backend_start          | wait_event_type |  wait_event  | backend_type
------+-------------------------------+-----------------+--------------+--------------
   34 | 2025-12-09 11:44:23.852461+00 | Activity        | IoWorkerMain | io worker
   35 | 2025-12-09 11:44:23.852832+00 | Activity        | IoWorkerMain | io worker
   36 | 2025-12-09 11:44:23.853119+00 | IO              | DataFileRead | io worker
   37 | 2025-12-09 11:44:23.8534+00   | IO              | DataFileRead | io worker
SELECT a.pid, a.usename, a.application_name, a.backend_type, a.state, a.query,
ai.operation, ai.state AS aio_state, ai.length AS aio_bytes, ai.target_desc
FROM pg_aios ai
JOIN pg_stat_activity a ON a.pid = ai.pid
ORDER BY a.backend_type, a.pid, ai.io_id;


-[ RECORD 1 ]----+------------------------------------------------------------------------
             pid | 58
         usename | postgres
application_name | psql
    backend_type | client backend
           state | active
           query | explain analyze SELECT ........
       operation | readv
       aio_state | SUBMITTED
       aio_bytes | 704512
     target_desc | blocks 539820..539905 in file "pg_tblspc/16647/PG_18_202506291/5/16716"
-[ RECORD 2 ]----+------------------------------------------------------------------------
             pid | 159
         usename | postgres
application_name | psql
    backend_type | parallel worker
           state | active
           query | explain analyze SELECT ........
       operation | readv
       aio_state | SUBMITTED
       aio_bytes | 704512
     target_desc | blocks 536326..536411 in file "pg_tblspc/16647/PG_18_202506291/5/16716"
pg_aios: Current AIO handles
- pid: backend issuing the I/O
- io_id, io_generation: identify a handle across reuse
- state: HANDED_OUT, DEFINED, STAGED, SUBMITTED, COMPLETED_IO, COMPLETED_SHARED, COMPLETED_LOCAL
- operation: invalid, readv (vectored read) or writev (vectored write)
- off, length: offset and size of I/O operation
- target, target_desc: what we’re reading/writing (typically relations)
- result: UNKNOWN, OK, PARTIAL, WARNING, ERROR
-- Summary of current AIO handles by state and result
SELECT state, result, count(*) AS cnt, pg_size_pretty(sum(length)) AS total_size
FROM pg_aios GROUP BY state, result ORDER BY state, result;

       state      |  result | cnt | total_size
------------------+---------+-----+------------
 COMPLETED_SHARED | OK      |   1 | 688 kB
 SUBMITTED        | UNKNOWN |   6 | 728 kB

-- In-flight async I/O handles
SELECT COUNT(*) AS aio_handles, SUM(length) AS aio_bytes FROM pg_aios;

 aio_handles | aio_bytes
-------------+-----------
           7 |     57344

-- Sessions currently waiting on I/O
SELECT COUNT(*) AS sessions_waiting_on_io FROM pg_stat_activity WHERE wait_event_type = 'IO';

 sessions_waiting_on_io
------------------------
9SELECT pid, state, operation, pg_size_pretty(length) AS io_size, target_desc, result FROM pg_aios ORDER BY pid, io_id; pid | state | operation | io_size | target_desc | result -----+-----------+-----------+------------+-------------------------------------------------------------------------+--------- 51 | SUBMITTED | readv | 688 kB | blocks 670470..670555 in file "pg_tblspc/16647/PG_18_202506291/5/16716" | UNKNOWN 63 | SUBMITTED | readv | 8192 bytes | block 1347556 in file "pg_tblspc/16647/PG_18_202506291/5/16719" | UNKNOWN 65 | SUBMITTED | readv | 688 kB | blocks 671236..671321 in file "pg_tblspc/16647/PG_18_202506291/5/16716" | UNKNOWN 66 | SUBMITTED | readv | 8192 bytes | block 1344674 in file "pg_tblspc/16647/PG_18_202506291/5/16719" | UNKNOWN 67 | SUBMITTED | readv | 8192 bytes | block 1337819 in file "pg_tblspc/16647/PG_18_202506291/5/16719" | UNKNOWN 68 | SUBMITTED | readv | 688 kB | blocks 672002..672087 in file "pg_tblspc/16647/PG_18_202506291/5/16716" | UNKNOWN 69 | SUBMITTED | readv | 688 kB | blocks 673964..674049 in file "pg_tblspc/16647/PG_18_202506291/5/16716" | UNKNOWN
pg_stat_io: Cumulative I/O stats
SELECT backend_type, context, sum(reads) AS reads,
pg_size_pretty(sum(read_bytes)) AS read_bytes,
round(sum(read_time)::numeric, 2) AS read_ms, sum(writes) AS writes,
pg_size_pretty(sum(write_bytes)) AS write_bytes,
round(sum(write_time)::numeric, 2) AS write_ms, sum(extends) AS extends,
pg_size_pretty(sum(extend_bytes)) AS extend_bytes
FROM pg_stat_io
WHERE object = 'relation' AND backend_type IN ('client backend')
GROUP BY backend_type, context
ORDER BY backend_type, context;

   backend_type |  context  |  reads  | read_bytes |  read_ms  | writes | write_bytes | write_ms | extends | extend_bytes
----------------+-----------+---------+------------+-----------+--------+-------------+----------+---------+--------------
 client backend | bulkread  |   13833 | 9062 MB    | 124773.28 |      0 | 0 bytes     |     0.00 |         |
 client backend | bulkwrite |       0 | 0 bytes    |      0.00 |      0 | 0 bytes     |     0.00 |       0 | 0 bytes
 client backend | init      |       0 | 0 bytes    |      0.00 |      0 | 0 bytes     |     0.00 |       0 | 0 bytes
 client backend | normal    | 2265214 | 17 GB      | 553940.57 |      0 | 0 bytes     |     0.00 |       0 | 0 bytes
 client backend | vacuum    |       0 | 0 bytes    |      0.00 |      0 | 0 bytes     |     0.00 |       0 | 0 bytes


-- Top tables by heap blocks read and cache hit ratio
SELECT relid::regclass AS table_name, heap_blks_read, heap_blks_hit,
ROUND( CASE WHEN heap_blks_read + heap_blks_hit = 0 THEN 0
ELSE heap_blks_hit::numeric / (heap_blks_read + heap_blks_hit) * 100 END, 2) AS cache_hit_pct
FROM pg_statio_user_tables
ORDER BY heap_blks_read DESC LIMIT 20;

      table_name      | heap_blks_read | heap_blks_hit | cache_hit_pct
----------------------+----------------+---------------+---------------
 table1               |       18551282 |       3676632 |         16.54
 table2               |        1513673 |     102222970 |         98.54
 table3               |          19713 |       1034435 |         98.13
...


-- Top indexes by index blocks read and cache hit ratio
SELECT relid::regclass AS table_name, indexrelid::regclass AS index_name,
idx_blks_read, idx_blks_hit
FROM pg_statio_user_indexes
ORDER BY idx_blks_read DESC LIMIT 20;

 table_name |    index_name   | idx_blks_read | idx_blks_hit
------------+-----------------+---------------+--------------
 table1     | idx_table1_date |        209289 |          141
 table2     | table2_pkey     |         37221 |      1223747
 table3     | table3_pkey     |          9825 |      3143947
...SELECT pg_stat_reset_shared('io');Then run our workload and query pg_stat_io again to see how many bytes were read/written and how much time was spent waiting on I/O.
Conclusion
PostgreSQL is a registered trademark oftThe PostgreSQL Community Association of Canada.
In the past there have been many discussions about using UUID as a primary key in PostgreSQL. For some applications, even a BIGINT column does not have sufficient range: it is a signed 8‑byte integer with range −9,223,372,036,854,775,808 to +9,223,372,036,854,775,807. Although these values look big enough, if we think about web services that collect billions or more records daily, this number becomes less impressive. Simple integer values can also cause conflicts of values in distributed system, in Data Lakehouses when combining data from multiple source databases etc.
However, the main practical problem with UUIDv4 as a primary key in PostgreSQL was not lack of range, but the complete randomness of the values. This randomness causes frequent B‑tree page splits, a highly fragmented primary key index, and therefore a lot of random disk I/O. There have already been many articles and conference talks describing this problem. What many of these resources did not do, however, was dive deep into the on‑disk structures. That’s what I wanted to explore here.

What are UUIDs
UUID (Universally Unique Identifier) is a 16‑byte integer value (128 bits), which has 2^128 possible combinations (approximately 3.4 × 10^38). This range is so large that, for most applications, the probability of a duplicate UUID is practically zero. Wikipedia shows a calculation demonstrating that the probability to find a duplicate within 103 trillion version‑4 UUIDs is about one in a billion. Another often‑quoted rule of thumb is that to get a 50% chance of one collision, you’d have to generate roughly 1 billion UUIDs every second for about 86 years.
Values are usually represented as a 36‑character string with hexadecimal digits and hyphens, for example: f47ac10b-58cc-4372-a567-0e02b2c3d479. The canonical layout is 8‑4‑4‑4‑12 characters. The first character in the third block and the first character in the fourth block have special meaning: xxxxxxxx-xxxx-Vxxx-Wxxx-xxxxxxxxxxxx – V marks UUID version (4 for UUIDv4, 7 for UUIDv7, etc.), W encodes the variant in its upper 2 or 3 bits (the layout family of the UUID).
Until PostgreSQL 18, the common way to generate UUIDs in PostgreSQL was to use version‑4 (for example via gen_random_uuid() or uuid_generate_v4() from extensions). PostgreSQL 18 introduces native support for the new time‑ordered UUIDv7 via uuidv7() function, and also adds uuidv4() as a built‑in alias for older gen_random_uuid() function. UUID version 4 is generated completely randomly (except for the fixed version and variant bits), so there is no inherent sequence in the values. UUID version 7 generates values that are time‑ordered, because the first 48 bits contain a big‑endian Unix epoch timestamp with roughly millisecond granularity, followed by additional sub‑millisecond bits and randomness.

Test setup in PostgreSQL 18
I will show concrete results using a simple test setup – 2 different tables with column “id” containing generated UUID value (either v4 or v7), used as primary key, column “ord” with sequentially generated bigint, preserving the row creation order.
-- UUIDv4 (completely random keys)
CREATE TABLE uuidv4_demo (
    id uuid PRIMARY KEY DEFAULT uuidv4(), -- alias of gen_random_uuid()
    ord bigint GENERATED ALWAYS AS IDENTITY
);

-- UUIDv7 (time-ordered keys)
CREATE TABLE uuidv7_demo (
    id uuid PRIMARY KEY DEFAULT uuidv7(),
    ord bigint GENERATED ALWAYS AS IDENTITY
);

-- 1M rows with UUIDv4
INSERT INTO uuidv4_demo (id) SELECT uuidv4() FROM generate_series(1, 1000000);

-- 1M rows with UUIDv7
INSERT INTO uuidv7_demo (id) SELECT uuidv7() FROM generate_series(1, 1000000);

VACUUM ANALYZE uuidv4_demo;
VACUUM ANALYZE uuidv7_demo;
Query‑level performance: EXPLAIN ANALYZE
As the first step, let’s compare the costs of ordering by UUID for the two tables:
-- UUIDv4
EXPLAIN (ANALYZE, BUFFERS) SELECT * FROM uuidv4_demo ORDER BY id;

Index Scan using uuidv4_demo_pkey on uuidv4_demo (cost=0.42..60024.31 rows=1000000 width=24) (actual time=0.031..301.163 rows=1000000.00 loops=1)
  Index Searches: 1
  Buffers: shared hit=1004700 read=30
Planning Time: 0.109 ms
Execution Time: 318.005 ms

-- UUIDv7
EXPLAIN (ANALYZE, BUFFERS) SELECT * FROM uuidv7_demo ORDER BY id;

Index Scan using uuidv7_demo_pkey on uuidv7_demo (cost=0.42..36785.43 rows=1000000 width=24) (actual time=0.013..96.177 rows=1000000.00 loops=1)
  Index Searches: 1
  Buffers: shared hit=2821 read=7383
Planning Time: 0.040 ms
Execution Time: 113.305 ms
The exact buffer numbers depend on caching effects, but one thing is clear in this run: the index scan over UUIDv7 needs roughly 100 times less buffer hits and is around three times faster (113 ms vs 318 ms) for the same million‑row ORDER BY id. This is the first sign that UUIDv7 is a very viable solution for a primary key when we need to replace a BIGINT column with something that has a much larger space and uniqueness, while still behaving like a sequential key from the point of view of the index.
Speed of Inserts – simple benchmarking
Originally I wanted to make more sophisticated tests, but even very basic naive benchmark showed huge difference in speed of inserts. I compared time taken to insert 50 million rows into empty table, then again, into the table with 50 million existing rows.
INSERT INTO uuidv4_demo (id) SELECT uuidv4() FROM generate_series(1, 50000000);
INSERT INTO uuidv7_demo (id) SELECT uuidv7() FROM generate_series(1, 50000000);

-- UUID v4                                 -- UUID v7
                                Empty table
Insert time: 1239839.702 ms (20:39.840)    Insert time: 106343.314 ms (01:46.343)
Table size: 2489 MB                        Table size: 2489 MB
Index size: 1981 MB                        Index size: 1504 MB

                            Table with 50M rows
Insert time: 2776880.790 ms (46:16.881)    Insert time: 100354.087 ms (01:40.354)
Table size: 4978 MB                        Table size: 4978 MB
Index size: 3956 MB                        Index size: 3008 MB
As we can see, speed of inserts is radically different. Insertion of the first 50 million rows into empty table took only 1:46 minutes for UUIDv7, but already 20 minutes for UUIDv4. Second batch showed even 2 times bigger difference.
How values are distributed in the table
These results indicate huge differences in indexes. So let’s analyze it. First we will check how the values are distributed in the table, I use the following query for both tables (just switching the table name):
SELECT
    row_number() OVER () AS seq_in_uuid_order,
    id,
    ord,
    ctid
FROM uuidv4_demo
ORDER BY id
LIMIT 20;
Column seq_in_uuid_order is just the row number in UUID order, ord is the insertion order, ctid shows the physical location of each tuple in the heap: (block_number, offset_in_block).
UUIDv4: random UUID order ⇒ random heap access
How do the results look for UUIDv4?
 seq_in_uuid_order |                 id                   |   ord  |    ctid
-------------------+--------------------------------------+--------+------------
                 1 | 00000abf-cc8e-4cb2-a91a-701a3c96bd36 | 673969 | (4292,125)
                 2 | 00001827-16fe-4aee-9bce-d30ca49ceb1d | 477118 | (3038,152)
                 3 | 00001a84-6d30-492f-866d-72c3b4e1edff | 815025 | (5191,38)
                 4 | 00002759-21d1-4889-9874-4a0099c75286 | 879671 | (5602,157)
                 5 | 00002b44-b1b5-473f-b63f-7554fa88018d | 729197 | (4644,89)
                 6 | 00002ceb-5332-44f4-a83b-fb8e9ba73599 | 797950 | (5082,76)
                 7 | 000040e2-f6ac-4b5e-870a-63ab04a5fa39 | 160314 | (1021,17)
                 8 | 000053d7-8450-4255-b320-fee8d6246c5b | 369644 | (2354,66)
                 9 | 00009c78-6eac-4210-baa9-45b835749838 | 463430 | (2951,123)
                10 | 0000a118-f98e-4e4a-acb3-392006bcabb8 |  96325 | (613,84)
                11 | 0000be99-344b-4529-aa4c-579104439b38 | 454804 | (2896,132)
                12 | 00010300-fcc1-4ec4-ae16-110f93023068 |  52423 | (333,142)
                13 | 00010c33-a4c9-4612-ba9a-6c5612fe44e6 |  82935 | (528,39)
                14 | 00011fa2-32ce-4ee0-904a-13991d451934 | 988370 | (6295,55)
                15 | 00012920-38c7-4371-bd15-72e2996af84d | 960556 | (6118,30)
                16 | 00014240-7228-4998-87c1-e8b23b01194a |  66048 | (420,108)
                17 | 00014423-15fc-42ca-89bd-1d0acf3e5ad2 | 250698 | (1596,126)
                18 | 000160b9-a1d8-4ef0-8979-8640025c0406 | 106463 | (678,17)
                19 | 0001711a-9656-4628-9d0c-1fb40620ba41 | 920459 | (5862,125)
                20 | 000181d5-ee13-42c7-a9e7-0f2c52faeadb | 513817 | (3272,113)
Values are distributed completely randomly. Reading rows in UUID order practically does not make sense here and leads directly into random heap access for queries that use the primary key index.
UUIDv7: UUID order follows insertion order
On the other hand, UUIDv7 values are generated in a clear sequence:
 seq_in_uuid_order |                  id                  | ord | ctid
-------------------+--------------------------------------+-----+--------
                 1 | 019ad94d-0127-7aba-b9f6-18620afdea4a |   1 | (0,1)
                 2 | 019ad94d-0131-72b9-823e-89e41d1fad73 |   2 | (0,2)
                 3 | 019ad94d-0131-7384-b03d-8820be60f88e |   3 | (0,3)
                 4 | 019ad94d-0131-738b-b3c0-3f91a0b223a8 |   4 | (0,4)
                 5 | 019ad94d-0131-7391-ab84-a719ca98accf |   5 | (0,5)
                 6 | 019ad94d-0131-7396-b41d-7f9f27a179c4 |   6 | (0,6)
                 7 | 019ad94d-0131-739b-bdb3-4659aeaafbdd |   7 | (0,7)
                 8 | 019ad94d-0131-73a0-b271-7dba06512231 |   8 | (0,8)
                 9 | 019ad94d-0131-73a5-8911-5ec5d446c8a9 |   9 | (0,9)
                10 | 019ad94d-0131-73aa-a4a3-0e5c14f09374 |  10 | (0,10)
                11 | 019ad94d-0131-73af-ac4b-3710e221390e |  11 | (0,11)
                12 | 019ad94d-0131-73b4-85d6-ed575d11e9cf |  12 | (0,12)
                13 | 019ad94d-0131-73b9-b802-d5695f5bf781 |  13 | (0,13)
                14 | 019ad94d-0131-73be-bcb0-b0775dab6dd4 |  14 | (0,14)
                15 | 019ad94d-0131-73c3-9ec8-c7400b5c8983 |  15 | (0,15)
                16 | 019ad94d-0131-73c8-b067-435258087b3a |  16 | (0,16)
                17 | 019ad94d-0131-73cd-a03f-a28092604fb1 |  17 | (0,17)
                18 | 019ad94d-0131-73d3-b4d5-02516d5667b5 |  18 | (0,18)
                19 | 019ad94d-0131-73d8-9c41-86fa79f74673 |  19 | (0,19)
                20 | 019ad94d-0131-73dd-b9f1-dcd07598c35d |  20 | (0,20)
Here, seq_in_uuid_order, ord, and ctid all follow each other nicely – ord increases by 1 for each row, ctid moves sequentially through the first heap page, and UUIDs themselves are monotonic because of the timestamp prefix. For index scans on the primary key, this means Postgres can walk the heap in a much more sequential way than with UUIDv4.
How sequential are these values statistically?
After VACUUM ANALYZE, I ask the planner what it thinks about the correlation between id and the physical order:
SELECT
    tablename,
    attname,
    correlation
FROM pg_stats
WHERE tablename IN ('uuidv4_demo', 'uuidv7_demo')
AND attname = 'id'
ORDER BY tablename, attname;
Result:
   tablename | attname | correlation
-------------+---------+---------------
 uuidv4_demo |      id | -0.0024808696
 uuidv7_demo |      id |             1
The statistics confirm what we just saw:
- For uuidv4_demo.id, the correlation is essentially 0 ⇒ values are random with respect to heap order.
- For uuidv7_demo.id, the correlation is 1 ⇒ perfect alignment between UUID order and physical row order in this test run.
That high correlation is exactly why UUIDv7 is so attractive as a primary key for B‑tree indexes.
Primary key indexes: size, leaf pages, density, fragmentation
Next I look at the primary key indexes – their size, number of leaf pages, density, and fragmentation – using pgstatindex:
SELECT 'uuidv4_demo_pkey' AS index_name, (pgstatindex('uuidv4_demo_pkey')).*;

        index_name | uuidv4_demo_pkey
           version | 4
        tree_level | 2
        index_size | 40026112
     root_block_no | 295
    internal_pages | 24
        leaf_pages | 4861
       empty_pages | 0
     deleted_pages | 0
  avg_leaf_density | 71
leaf_fragmentation | 49.99

SELECT 'uuidv7_demo_pkey' AS index_name, (pgstatindex('uuidv7_demo_pkey')).*;

        index_name | uuidv7_demo_pkey
           version | 4
        tree_level | 2
        index_size | 31563776
     root_block_no | 295
    internal_pages | 20
        leaf_pages | 3832
       empty_pages | 0
     deleted_pages | 0
  avg_leaf_density | 89.98      -- i.e. standard 90% fillfactor
leaf_fragmentation | 0
We can immediately see that the primary key index on UUIDv4 is about 26–27% bigger:
- index_size is ~40 MB vs ~31.6 MB
- leaf_pages are 4861 vs 3832 (again about 26–27% more)
- leaf pages in the v4 index have lower average density (71 vs ~90)
- leaf_fragmentation for v4 is about 50%, while for v7 it is 0
So UUIDv4 forces the B‑tree to allocate more pages and keep them less full, and it fragments the leaf level much more.
Deeper index analysis with bt_multi_page_stats
To go deeper, I examined the B‑tree indexes page by page and built some statistics. I used the following query for both indexes (just changing the index name in the CTE). The query calculates the minimum, maximum, and average number of tuples per index leaf page, and also checks how sequentially leaf pages are stored in the index file:
WITH leaf AS (
    SELECT *
    FROM bt_multi_page_stats('uuidv4_demo_pkey', 1, -1) -- from block 1 to end
    WHERE type = 'l'
)
SELECT
    count(*) AS leaf_pages,
    min(blkno) AS first_leaf_blk,
    max(blkno) AS last_leaf_blk,
    max(blkno) - min(blkno) + 1 AS leaf_span,
    round( count(*)::numeric / (max(blkno) - min(blkno) + 1), 3) AS leaf_density_by_span,
    min(live_items) AS min_tuples_per_page,
    max(live_items) AS max_tuples_per_page,
    avg(live_items)::numeric(10,2) AS avg_tuples_per_page,
    sum(CASE WHEN btpo_next = blkno + 1 THEN 1 ELSE 0 END) AS contiguous_links,
    sum(CASE WHEN btpo_next <> 0 AND btpo_next <> blkno + 1 THEN 1 ELSE 0 END) AS non_contiguous_links
FROM leaf;
Results for UUIDv4:
-- uuidv4_demo_pkey
          leaf_pages | 4861
      first_leaf_blk | 1
       last_leaf_blk | 4885
           leaf_span | 4885
leaf_density_by_span | 0.995
 min_tuples_per_page | 146
 max_tuples_per_page | 291
 avg_tuples_per_page | 206.72
    contiguous_links | 0
non_contiguous_links | 4860
Results for UUIDv7:
-- uuidv7_demo_pkey
          leaf_pages | 3832
      first_leaf_blk | 1
       last_leaf_blk | 3852
           leaf_span | 3852
leaf_density_by_span | 0.995
 min_tuples_per_page | 109
 max_tuples_per_page | 262
 avg_tuples_per_page | 261.96
    contiguous_links | 3812
non_contiguous_links | 19
As we can see- the UUIDv4 index has more leaf pages, spread over a larger span of blocks, and although it has higher minimum and maximum tuples per page, its average number of tuples per leaf page (206.72) is significantly lower than for UUIDv7 (261.96).
But these numbers can obscure the whole pictures. So, let’s look at histograms visualizing count of tuples in leaf pages. For this I will use following query with buckets between 100 and 300 and will list only non empty results:
WITH leaf AS (
    SELECT live_items
    FROM bt_multi_page_stats('uuidv4_demo_pkey', 1, -1)
    WHERE type = 'l'
),
buckets AS (
    -- bucket lower bounds: 100, 110, ..., 290
    SELECT generate_series(100, 290, 10) AS bucket_min
)
SELECT
    b.bucket_min AS bucket_from,
    b.bucket_min + 9 AS bucket_to,
    COUNT(l.live_items) AS page_count
FROM buckets b
LEFT JOIN leaf l
    ON l.live_items BETWEEN b.bucket_min AND b.bucket_min + 9
GROUP BY b.bucket_min HAVING count(l.live_items) > 0
ORDER BY b.bucket_min;
Result for UUIDv4:
 bucket_from | bucket_to | page_count
-------------+-----------+------------
         140 |       149 |        159
         150 |       159 |        435
         160 |       169 |        388
         170 |       179 |        390
         180 |       189 |        427
         190 |       199 |        466
         200 |       209 |        430
         210 |       219 |        387
         220 |       229 |        416
         230 |       239 |        293
         240 |       249 |        296
         250 |       259 |        228
         260 |       269 |        214
         270 |       279 |        171
         280 |       289 |        140
         290 |       299 |         21
Result for UUIDv7:
 bucket_from | bucket_to | page_count
-------------+-----------+------------
         100 |       109 |          1
         260 |       269 |       3831
There results nicely demonstrate huge fragmentation of UUIDv4 index and stable compact structure of UUIDv7 index. The lowest buckets in UUIDv4 histogram show cases of half empty leaf index pages, on the other hand pages with more than 270 tuples exceed 90% fillfactor, because PostgreSQL uses remaining free space to avoid split. In the UUIDv7 index all leaf pages except for one (the very last one in the tree) are filled up to 90% standard fillfactor.
Another important result is in the last two columns of index statistics:
- For UUIDv4: contiguous_links = 0, non_contiguous_links = 4860
- For UUIDv7: contiguous_links = 3812, non_contiguous_links = 19
btpo_next = blkno + 1 means the next leaf page in the logical B‑tree order is also the next physical block. With UUIDv4, that never happens in this test – the leaf pages are completely fragmented, randomly distributed over the index structure. With UUIDv7, almost all leaf pages are contiguous, i.e. nicely follow each other.
Also, when we examine the actual content of leaf pages, we can immediately see the randomness of UUIDv4 versus the sequential behavior of UUIDv7: UUIDv4 leaf pages point to heap tuples scattered all over the table, while UUIDv7 leaf pages tend to point into tight ranges of heap pages. The result is the same pattern we saw earlier when looking at ctid directly from the table, so I won’t repeat the raw dumps here.
A small gotcha: embedded timestamp in UUIDv7
There is one small gotcha with UUIDv7 values: they expose a timestamp of creation. PostgreSQL 18 exposes this explicitly via uuid_extract_timestamp():
SELECT
    id,
    uuid_extract_timestamp(id) AS created_at_from_uuid
FROM uuidv7_demo
ORDER BY ord
LIMIT 5;
Sample results:
                   id                 |       created_at_from_uuid
--------------------------------------+----------------------------
 019ad94d-0127-7aba-b9f6-18620afdea4a | 2025-12-01 09:44:53.799+00
 019ad94d-0131-72b9-823e-89e41d1fad73 | 2025-12-01 09:44:53.809+00
 019ad94d-0131-7384-b03d-8820be60f88e | 2025-12-01 09:44:53.809+00
 019ad94d-0131-738b-b3c0-3f91a0b223a8 | 2025-12-01 09:44:53.809+00
 019ad94d-0131-7391-ab84-a719ca98accf | 2025-12-01 09:44:53.809+00
If we look at the whole sequence of values, we can analyze the time deltas between record creations directly from the UUIDs, without any separate timestamp column. For some applications this could be considered a potential information leak (for example, revealing approximate creation times or request rates), while many others will most likely not care.
Summary
- UUIDs provide an enormous identifier space (128 bits, ~3.4 × 10^38 values) where the probability of collision is negligible for real‑world workloads.
- Traditional UUIDv4 keys are completely random. When used as primary keys in PostgreSQL, they tend to:
- fragment B‑tree indexes
- lower leaf page density
- cause highly random heap access patterns and more random I/O
- UUIDv7, introduced natively in PostgreSQL 18 as uuidv7(), keeps the 128‑bit space but reorders the bits so that:
- the most significant bits contain a Unix timestamp with millisecond precision (plus sub‑millisecond fraction)
- the remaining bits stay random
- In practical tests with 1M rows per table:
- The UUIDv7 primary key index was about 26–27% smaller, with fewer leaf pages and much higher average leaf density
- Leaf pages in the UUIDv7 index were overwhelmingly physically contiguous, whereas the UUIDv4 leaf pages were completely fragmented
- An ORDER BY id query over UUIDv7 was roughly three times faster in my run than the same query over UUIDv4, thanks to better index locality and more sequential heap access
The trade‑off is that UUIDv7 embeds a timestamp, which might expose approximate creation times, but for most use cases this is acceptable or even useful. So, UUIDv7 significantly improves the performance and physical layout of UUID primary keys in PostgreSQL, not by abandoning randomness, but by adding a time‑ordered prefix. In PostgreSQL 18, that gives us the best of both worlds: the huge identifier space and distributed generation benefits of UUIDs, with index behavior much closer to a classic sequential BIGINT primary key.
PostgreSQL is an open-source database provided by the PostgreSQL developers. The PostgreSQL Elephant Logo (“Slonik”), Postgres and PostgreSQL are registered trademarks by the PostgreSQL Community Association.
We at credativ provide comprehensive support and consulting services running PostgreSQL and other open-source systems.
The European PostgreSQL Conference (PGConf.EU) is one of the largest PostgreSQL events worldwide. In this year it was held 21–24 October in Riga, Latvia. Our company, credativ GmbH, was a bronze sponsor of the conference, and I had the privilege to represent credativ with my talk “Database in Distress: Testing and Repairing Different Types of Database Corruption.” In addition, I volunteered as a session host on Thursday and Friday. The conference itself covered a wide range of PostgreSQL topics – from cloud-native deployments to AI integration, from large-scale migrations to resiliency. Below are highlights from sessions I attended, organised by day.
My talk about database corruption
I presenting my talk on Friday afternoon. In it I dove into real-world cases of PostgreSQL database corruption I encountered over the past two years. To investigate these issues, I built a Python tool that deliberately corrupts database pages and then examined the results using PostgreSQL’s pageinspect extension. During the talk I demonstrated various corruption scenarios and the errors they produce, explaining how to diagnose each case. A key point was that PostgreSQL 18 now enables data checksums by default at initdb. Checksums allow damaged pages to be detected and safely “zeroed out” (skipping corrupted data) during recovery. Without checksums, only pages with clearly corrupted headers can be automatically removed using the zero_damaged_pages = on setting. Other types of corruption require careful manual salvage. I concluded by suggesting improvements (in code or settings) to make recovery easier on clusters without checksums.

Tuesday: Kubernetes and AI Summits
Tuesday began with two half-day Summits. The PostgreSQL on Kubernetes Summit explored running Postgres in cloud-native environments. Speakers compared Kubernetes operators (CloudNativePG, Crunchy, Zalando, etc.), backup/recovery in Kubernetes, scaling strategies, monitoring, and zero-downtime upgrades. They discussed operator architectures and multi-tenant DBaaS use cases. Attendees gained practical insight into trade-offs of different operators and how to run Kubernetes-based Postgres for high availability.
In the PostgreSQL & AI Summit, experts examined Postgres’s role in AI applications. Topics included vector search (e.g. pgvector), hybrid search, using Postgres as context storage for AI agents, conversational query interfaces, and even tuning Postgres with machine learning. Presenters shared best practices and integration strategies for building AI-driven solutions with Postgres. In short, the summit explored how PostgreSQL can serve AI workloads (and vice versa) and what new features or extensions are emerging for AI use cases.
Wednesday: Migrations, Modelling, and Performance
Joaquim Oliveira (European Space Agency) discussed moving astronomy datasets (from ESA’s Gaia and Euclid missions) off Greenplum. The team considered both scaling out with Citus and moving to EDB’s new Greenplum-based cloud warehouse. He covered the practical pros and cons of each path and the operational changes required to re-architect such exascale workloads. The key lesson was planning architecture, tooling, and admin shifts needed before undertaking a petabyte-scale migration.
Boriss Mejias (EDB) emphasised that data modelling is fundamental to software projects. Using a chess-tournament application as an example, he showed how to let PostgreSQL enforce data integrity. By carefully choosing data types and constraints, developers can embed much of the business logic directly in the schema. The talk demonstrated “letting PostgreSQL guarantee data integrity” and building application logic at the database layer.
Roberto Mello (Snowflake) reviewed the many optimizer and execution improvements in Postgres 18. For example, the planner now automatically eliminates unnecessary self-joins, converts IN (VALUES…) clauses into more efficient forms, and transforms OR clauses into arrays for faster index scans. It also speeds up set operations (INTERSECT, EXCEPT), window aggregates, and optimises SELECT DISTINCT and GROUP BY by reordering keys and ignoring redundant columns. Roberto compared query benchmarks across Postgres 16, 17, and 18 to highlight these gains.
Nelson Calero (Pythian) shared a “practical guide” for migrating 100+ PostgreSQL databases (from gigabytes to multi-terabytes) to the cloud. His team moved hundreds of on-prem VM databases to Google Cloud SQL. He discussed planning, downtime minimisation, instance sizing, tools, and post-migration tuning. In particular, he noted challenges like handling old version upgrades, inheritance schemas, PostGIS data, and service-account changes. Calero’s advice included choosing the right cloud instance types, optimising bulk data loads, and validating performance after migration.
Jan Wieremjewicz (Percona) recounted implementing Transparent Data Encryption (TDE) for Postgres via the pg_tde extension. He took the audience through the entire journey – from the initial idea, through patch proposals, to community feedback and design trade-offs. He explained why existing PostgreSQL hooks weren’t enough, what friction was encountered, and how customer feedback shaped the final design. This talk served as a “diary” of what it takes to deliver a core encryption feature through the PostgreSQL development process.
Stefan Fercot (Data Egret) demonstrated how to use Patroni (for high availability) together with pgBackRest (for backups). He walked through YAML configuration examples showing how to integrate pgBackRest into a Patroni-managed cluster. Stefan showed how to rebuild standby replicas from pgBackRest backups and perform point-in-time recovery (PITR) under Patroni’s control. The talk highlighted real-world operational wisdom: combining these tools provides automated, repeatable disaster recovery for Postgres clusters.
Thursday: Cloud, EXPLAIN, and Resiliency
Maximilian Stefanac and Philipp Thun (SAP SE) explained how SAP uses PostgreSQL within Cloud Foundry (SAP’s open-source PaaS). They discussed optimisations and scale challenges of running Postgres for SAP’s Business Technology Platform. Over the years, SAP’s Cloud Foundry team has deployed Postgres on AWS, Azure, Google Cloud, and Alibaba Cloud. Each provider’s offerings differ, so unifying automation and monitoring across clouds is a major challenge. The talk highlighted how SAP contributes Postgres performance improvements back to the community and what it takes to operate large-scale, cloud-neutral Postgres clusters.
In “EXPLAIN: Make It Make Sense,” Aivars Kalvāns (Ebury) helped developers interpret query plans. He emphasized that after identifying a slow query, you must understand why the planner chose a given plan and whether it is optimal. Aivars walked through EXPLAIN output and shared rules of thumb for spotting inefficiencies – for example, detecting missing indexes or costly operators. He illustrated common query anti-patterns he has seen in practice and showed how to rewrite them in a more database-friendly way. The session gave practical tips for decoding EXPLAIN and tuning queries.
Chris Ellis (Nexteam) highlighted built-in Postgres capabilities that simplify application development. Drawing on real-world use cases – such as event scheduling, task queues, search, geolocation, and handling heterogeneous data – he showed how features like range types, full-text search, and JSONB can reduce application complexity. For each use case, Chris demonstrated which Postgres feature or data type could solve the problem. This “tips & tricks” tour reinforced that leveraging Postgres’s rich feature set often means writing less custom code.
Andreas Geppert (Zürcher Kantonalbank) described a cross-cloud replication setup for disaster resilience. Faced with a requirement that at most 15 minutes of data could be lost if any one cloud provider failed, they could not use physical replication (since their cloud providers don’t support it). Instead, they built a multi-cloud solution using logical replication. The talk covered how they keep logical replicas up-to-date even as schemas change (noting that logical replication doesn’t automatically copy DDL). In short, logical replication enabled resilient, low-RPO operation across providers despite schema evolution.
Derk van Veen (Adyen) tackled the deeper rationale behind table partitioning. He emphasised the importance of finding the right partition key – the “leading figure” in your data – and then aligning partitions across all related tables. When partitions share a common key and aligned boundaries, you unlock multiple benefits: decent performance, simplified maintenance, built-in support for PII compliance, easy data cleanup, and even transparent data tiering. Derk warned that poorly planned partitions can hurt performance terribly. In his case, switching to properly aligned partitions (and enabling enable_partitionwise_join/_aggregate) yielded a 70× speedup on 100+ TB financial tables. All strategies he presented have been battle-tested in Adyen’s multi-100 TB production database.
Friday: Other advanced Topics
Nicholas Meyer (Academia.edu) introduced thin cloning, a technique for giving developers real production data snapshots for debugging. Using tools like DBLab Engine or Amazon Aurora’s clone feature, thin cloning creates writable copies of live data inexpensively. This lets developers reproduce production issues exactly – including data-dependent bugs – by debugging against these clones of real data. Nicholas explained how Academia.edu uses thin clones to catch subtle bugs early by having dev and QA teams work with near-production data.
Dave Pitts (Adyen) explained why future Postgres applications may use both B-tree and LSM-tree (log-structured) indexes. He outlined the fundamental differences: B-trees excel at point lookups and balanced reads/writes, while LSM-trees optimise high write throughput and range scans. Dave discussed “gotchas” when switching workloads between index types. The talk clarified when each structure is advantageous, helping developers and DBAs choose the right index for their workload.

A panel led by Jimmy Angelakos addressed “How to Work with Other Postgres People”. The discussion focused on mental health, burnout, and neurodiversity in the PostgreSQL community. Panelists highlighted that unaddressed mental-health issues cause stress and turnover in open-source projects. They shared practical strategies for a more supportive culture: personal “README” guides to explain individual communication preferences, respectful and empathetic communication practices, and concrete conflict resolution techniques. The goal was to make the Postgres community more welcoming and resilient by understanding diverse needs and supporting contributors effectively.
Lukas Fittl (pganalyze) presented new tools for tracking query plan changes over time. He showed how to assign stable Plan IDs (analogous to query IDs) so that DBAs can monitor which queries use which plan shapes. Lukas introduced the new pg_stat_plans extension (leveraging Postgres 18’s features) for low-overhead collection of plan statistics. He explained how this extension works and compared it to older tools (the original pg_stat_plans, pg_store_plans, etc.) and cloud provider implementations. This makes it easier to detect when a query’s execution plan changes in production, aiding performance troubleshooting.
Ahsan Hadi (pgEdge) described pgEdge Enterprise PostgreSQL, a 100% open-source distributed Postgres platform. pgEdge Enterprise Postgres provides built-in high availability (using Patroni and read replicas) and the ability to scale across global regions. Starting from a single-node Postgres, users can grow to a multi-region cluster with geo-distributed replicas for extreme availability and low latency. Ahsan demonstrated how pgEdge is designed for organizations that need to scale from single instances to large distributed deployments, all under the standard Postgres license.
Conclusion
PGConf.EU 2025 was an excellent event for sharing knowledge and learning from the global PostgreSQL community. I was proud to represent credativ and to help as a volunteer, and I’m grateful for the many insights gained. The sessions above represent just a selection of the rich content covered at the conference. Overall, PostgreSQL’s strong community and rapid innovation continue to make these conferences highly valuable. I look forward to applying what I learned in my work and to attending future PGConf.EU events.
As I explained in my talk on PostgreSQL Conference Europe 2025, data corruption can be silently present in any PostgreSQL database and will remain undetected until we physically read corrupted data. There can be many reasons why some data blocks in tables or other objects can be damaged. Even modern storage hardware is far from being infallible. Binary backups done with pg_basebackup tool – which is very common backup strategy in PostgreSQL environment – leave these problems hidden. Because they do not check data but copy whole data files as they are. With release of PostgreSQL 18, the community decided to turn on data‑checksums by default – a major step toward early detection of these failures. This post examines how PostgreSQL implements checksums, how it handles checksum failures, and how we can enable them on existing clusters.
 On September 4, 2025, the third pgday Austria took place in the Apothecary Wing of Schönbrunn Palace in Vienna, following the previous events in 2021 and 2022.
153 participants had the opportunity to attend a total of 21 talks and visit 15 different sponsors, discussing all possible topics related to PostgreSQL and the community.
Also present this time was the Sheldrick Wildlife Trust, which is dedicated to rescuing elephants and rhinos. Attendees could learn about the project, make donations, and participate in a raffle.
The talks ranged from topics such as benchmarking and crash recovery to big data.
Our colleague was also represented with his talk “Postgres with many data: To MAXINT and beyond“.
As a special highlight, at the end of the day, before the networking event, and in addition to the almost obligatory lightning talks, there was a “Celebrity DB Deathmatch” where various community representatives came together for a very entertaining stage performance to find the best database in different disciplines. To everyone’s (admittedly not great) surprise, PostgreSQL was indeed able to excel in every category.
Additionally, our presence with our own booth gave us the opportunity to have many very interesting conversations and discussions with various community members, as well as sponsors and visitors in general.
For the first time, the new managing director of credativ GmbH was also on site after our re-independence and saw things for himself.
All in all, it was a (still) somewhat smaller, but nonetheless, as always, a very instructive and familiar event, and we are already looking forward to the next one and thank the organizers and the entire team on site and behind the scenes.