Replication Deadlock Bug in Current Postgres Releases 14-16
The current minor releases of Postgres versions 14-16 (14.23, 15.18 and 16.14, released on May 14th) introduced a regression that can lead to a MultiXactOffsetSLRU deadlock during transaction log (WAL) replay in certain circumstances.
The bug was (to our knowledge) first reported in Bug#19490 on May 20th by Radim Marek from BoringSQL. Further reports were done on the pgsql-bugs and pgsql-admin mailing lists and we also got customer support requests through our Open-Source Support Center.
What is Currently Known About This Bug
The bug can be hit in two ways. First, during streaming replication where the standby eventually hangs due to the deadlock. The other possibility is hanging point-in-time-recovery (PITR). The following is currently known:
The bug is only live on Postgres versions 14-16. Version 17 and 18 (and earlier versions) are not affected.
The WAL needs to be generated by a leader running the Q4/2025 (November 13th) back-branch releases or earlier (14.20/15.15/16.11).
The standby or the instance running PITR needs to be updated to the latest minor release (14.23/15.18/16.14).
The
startupprocess hangs with wait eventLWLock/MultiXactOffsetSLRUinpg_stat_activityduring WAL replay.
So to summarize, the leader needs to be at least a few minor versions behind and the standby needs to be updated to the latest minor version. Due to the recommended procedure of updating streaming standbys first before updating the leader, this bug is likely to be hit relatively often in the field, especially by organizations that only patch every few minor releases.
Circumventing the Issue
If one has not yet hit the issue, then not upgrading the standby or a PITR machine to the latest minor releases will avoid the problem. In the case that one is affected by the regression, there are four (well, currently three) ways to address the problem:
Downgrading the standby or the PITR instance to the Q1 (or earlier) point release (14.22/15.17/16.13) fixes the problem (but will potentially re-introduce problems fixed since).
A two-step upgrade procedure where first the standbys and then the leader are upgraded to the Q1 point releases (see previous option), followed by a second upgrade of the standbys (and then eventually the leader) to the latest point releases. This circumvents the issue as then the leader is on a safe version that will not emit the problematic WAL records that lead to the deadlock on the standbys.
Applying the patch “Fix self-deadlock when replaying WAL generated by older minor version” (version 16, version 15, version 14) from May 27th when self-compiling Postgres and starting the standby/PITR-instance with this also fixes the problem. Not using distribution packages of PostgreSQL is generally not advised, so this alternative should be chosen by organizations that always build PostgreSQL themselves anyway.
Upgrading to the upcoming minor releases (currently targeted for August 13th) will also fix the problem, once they are released.
The problem seems severe enough that one might think it should warrant an out-of-band back-branch release, which is what we have suggested on the PostgreSQL development list. So far, there have been a few other people confirming that they saw the bug (either in their own environment, or the environments of their customers), but no decision on a release has been made. As PostgreSQL 19 Beta 2 is currently scheduled for July 16th, it looks unlikely that another release could be squeezed in before. After the Beta 2 release, there is only one month left until the next scheduled minor releases. So probably no out-of-band release will be done for this issue and a downgrade of the standby (option 1 from above) or a two-step upgrade procedure (option 2 from above) should be chosen for the time being.
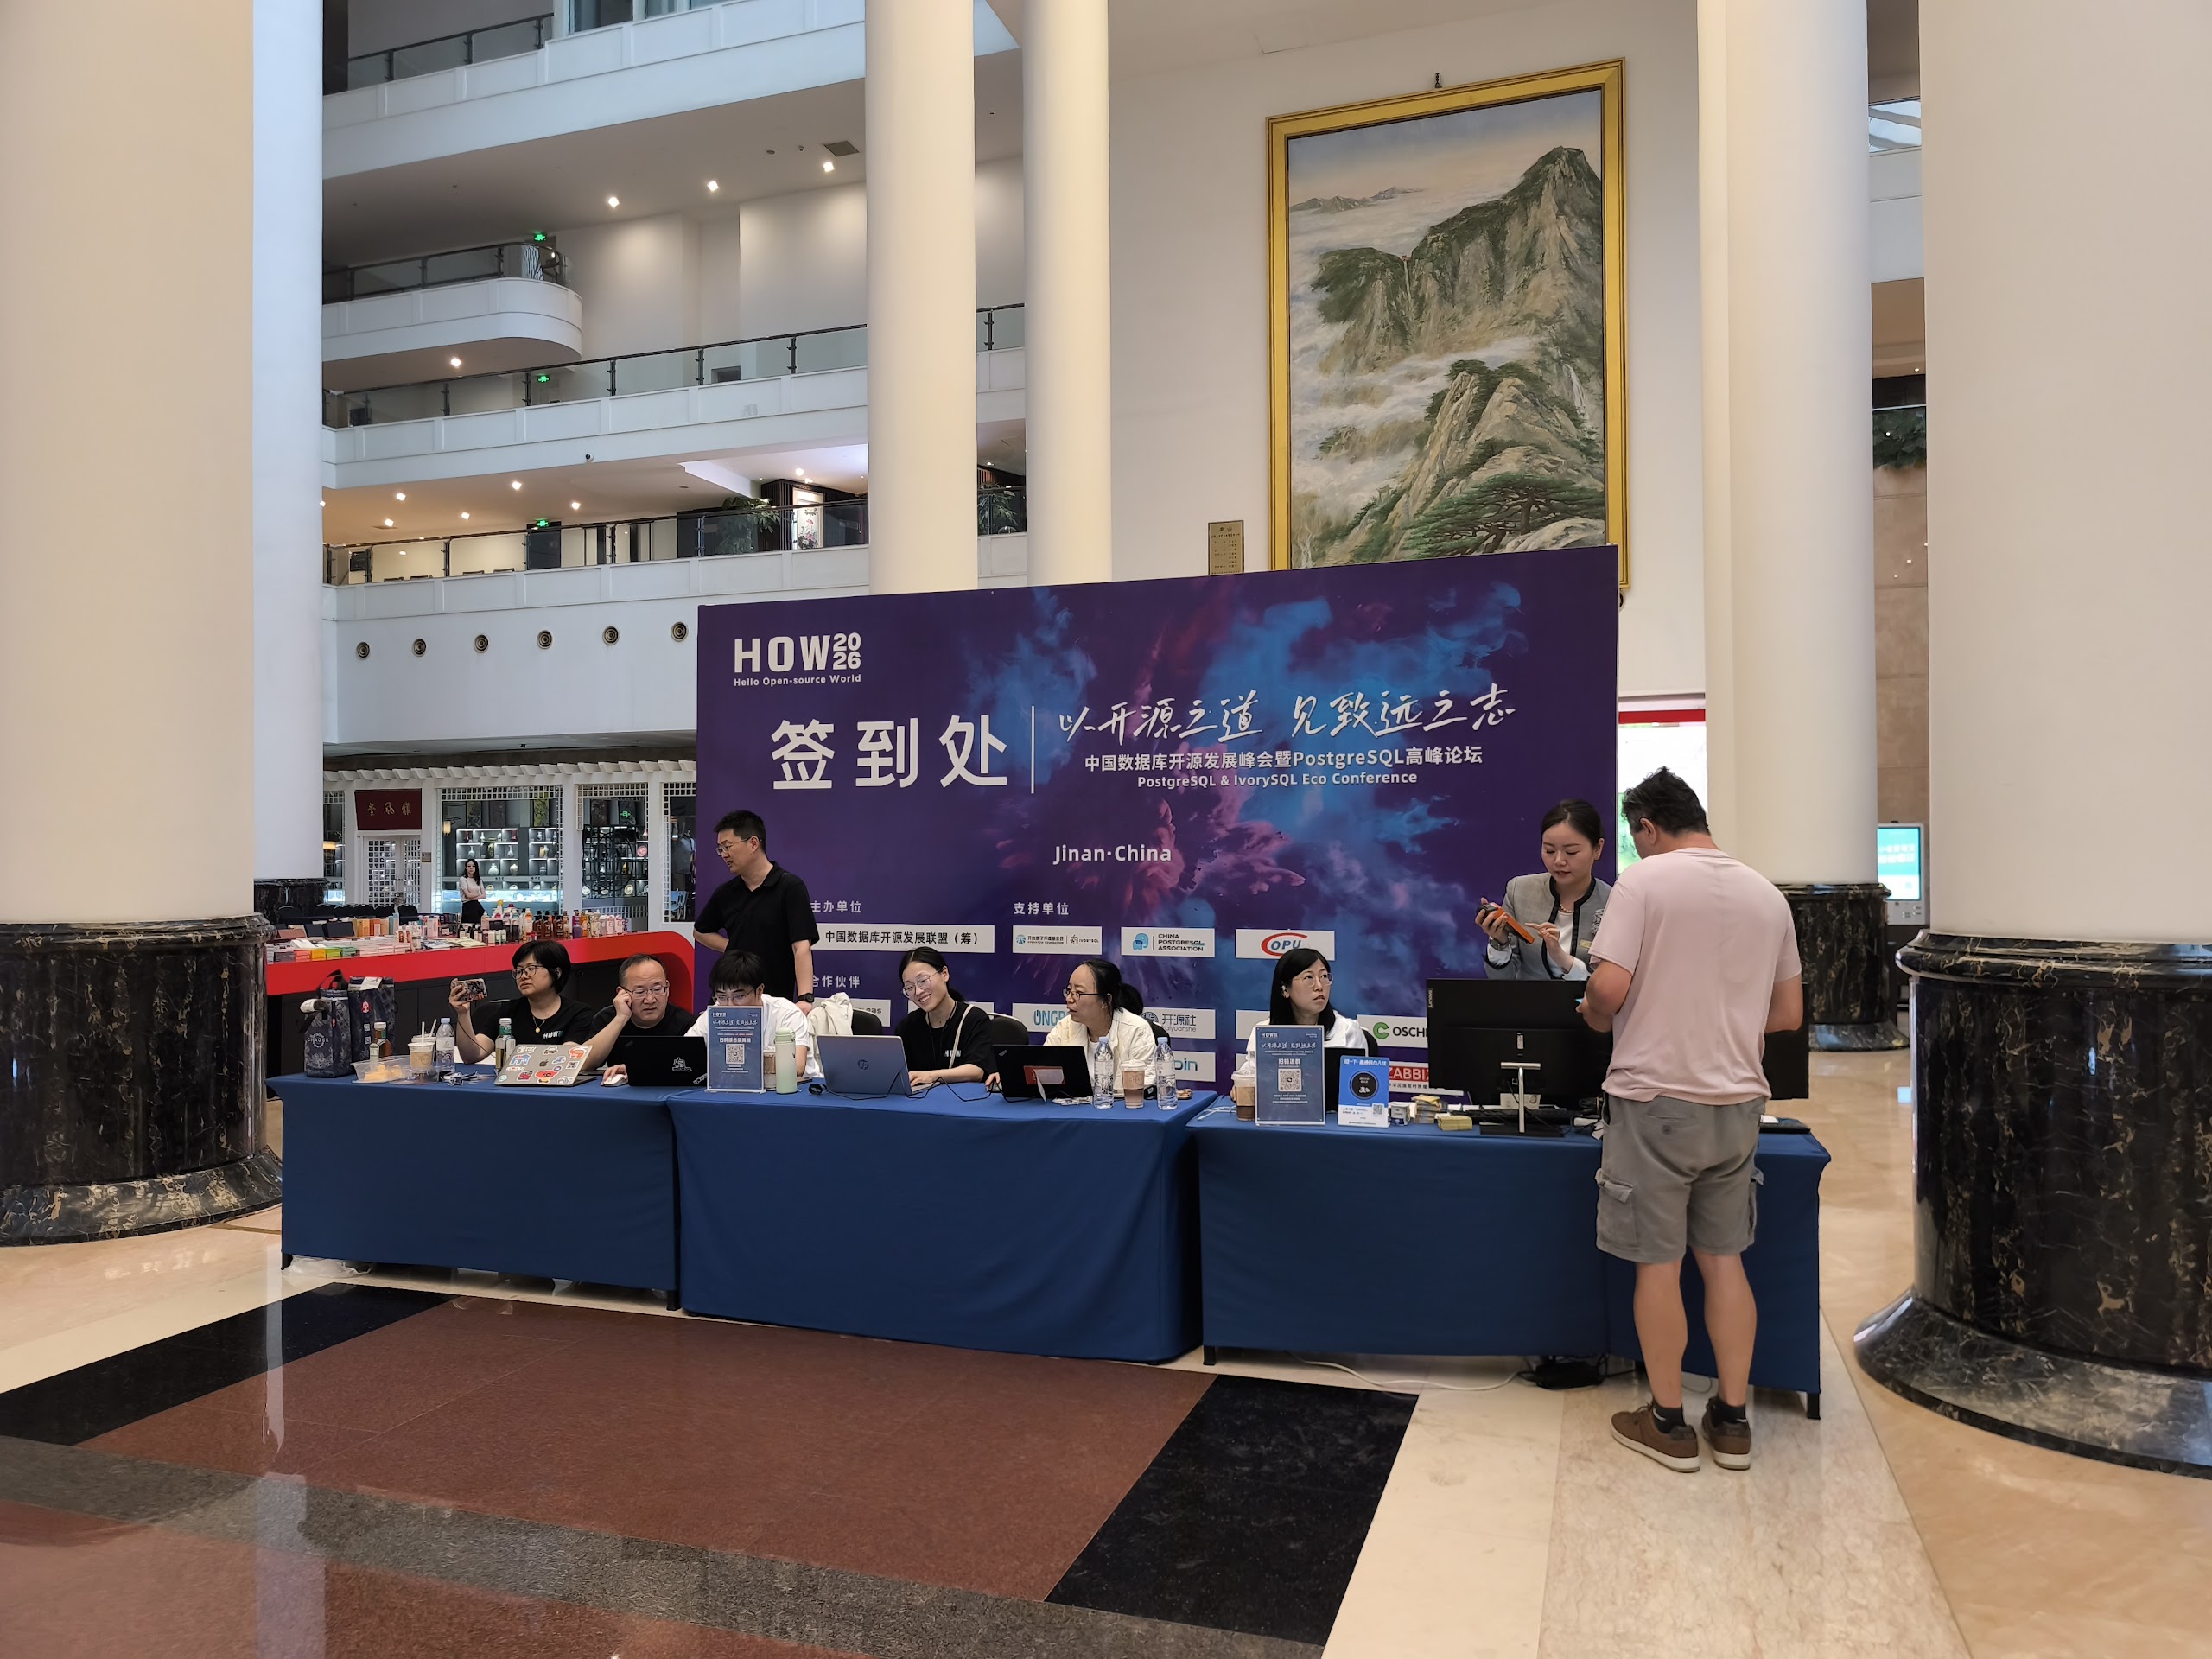
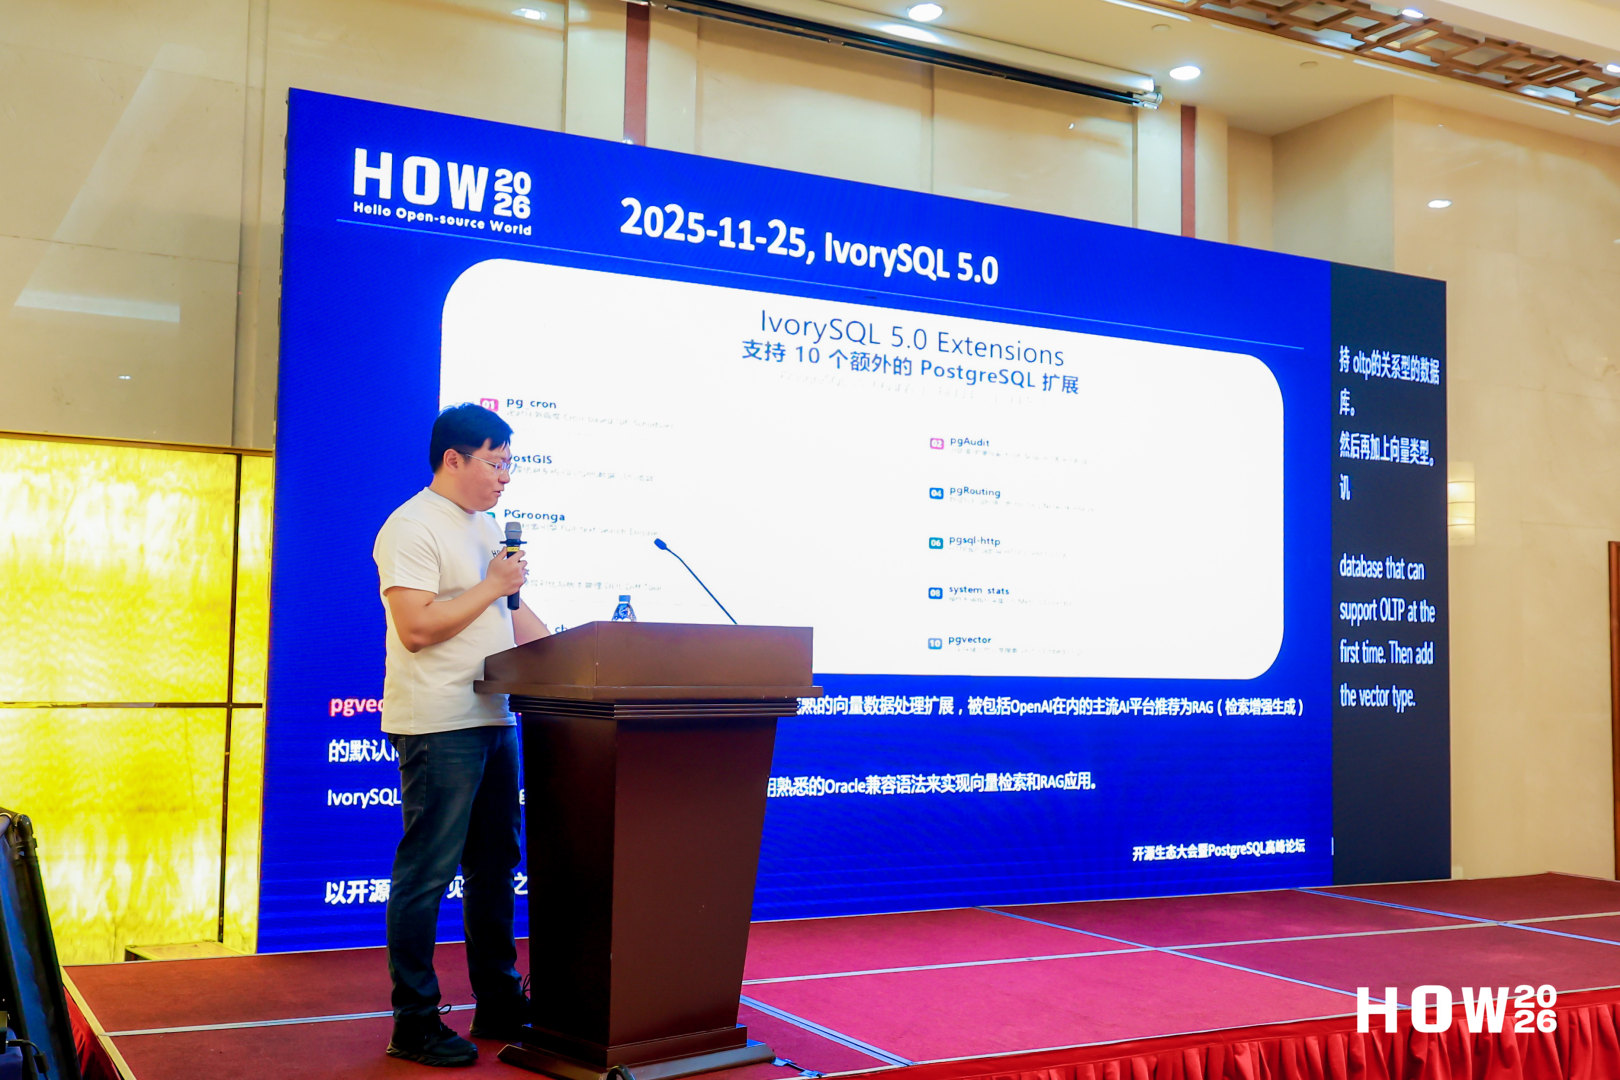
At the end of April, I had the incredible opportunity to represent credativ on the HOW2026 (Hello Open-source World), the PostgreSQL & IvorySQL Eco Conference in Jinan, China. IvorySQL is a Chinese fork of PostgreSQL with extended Oracle compatibility. In recent years, it has been gaining popularity not only in China. The conference brought together PostgreSQL and IvorySQL experts, contributors, and open-source database enthusiasts from around the world. The atmosphere was excellent, and I would like to share several highlights together with a recap of my contributions.
My Contributions
I was honored to contribute to the HOW2026 program with two sessions.
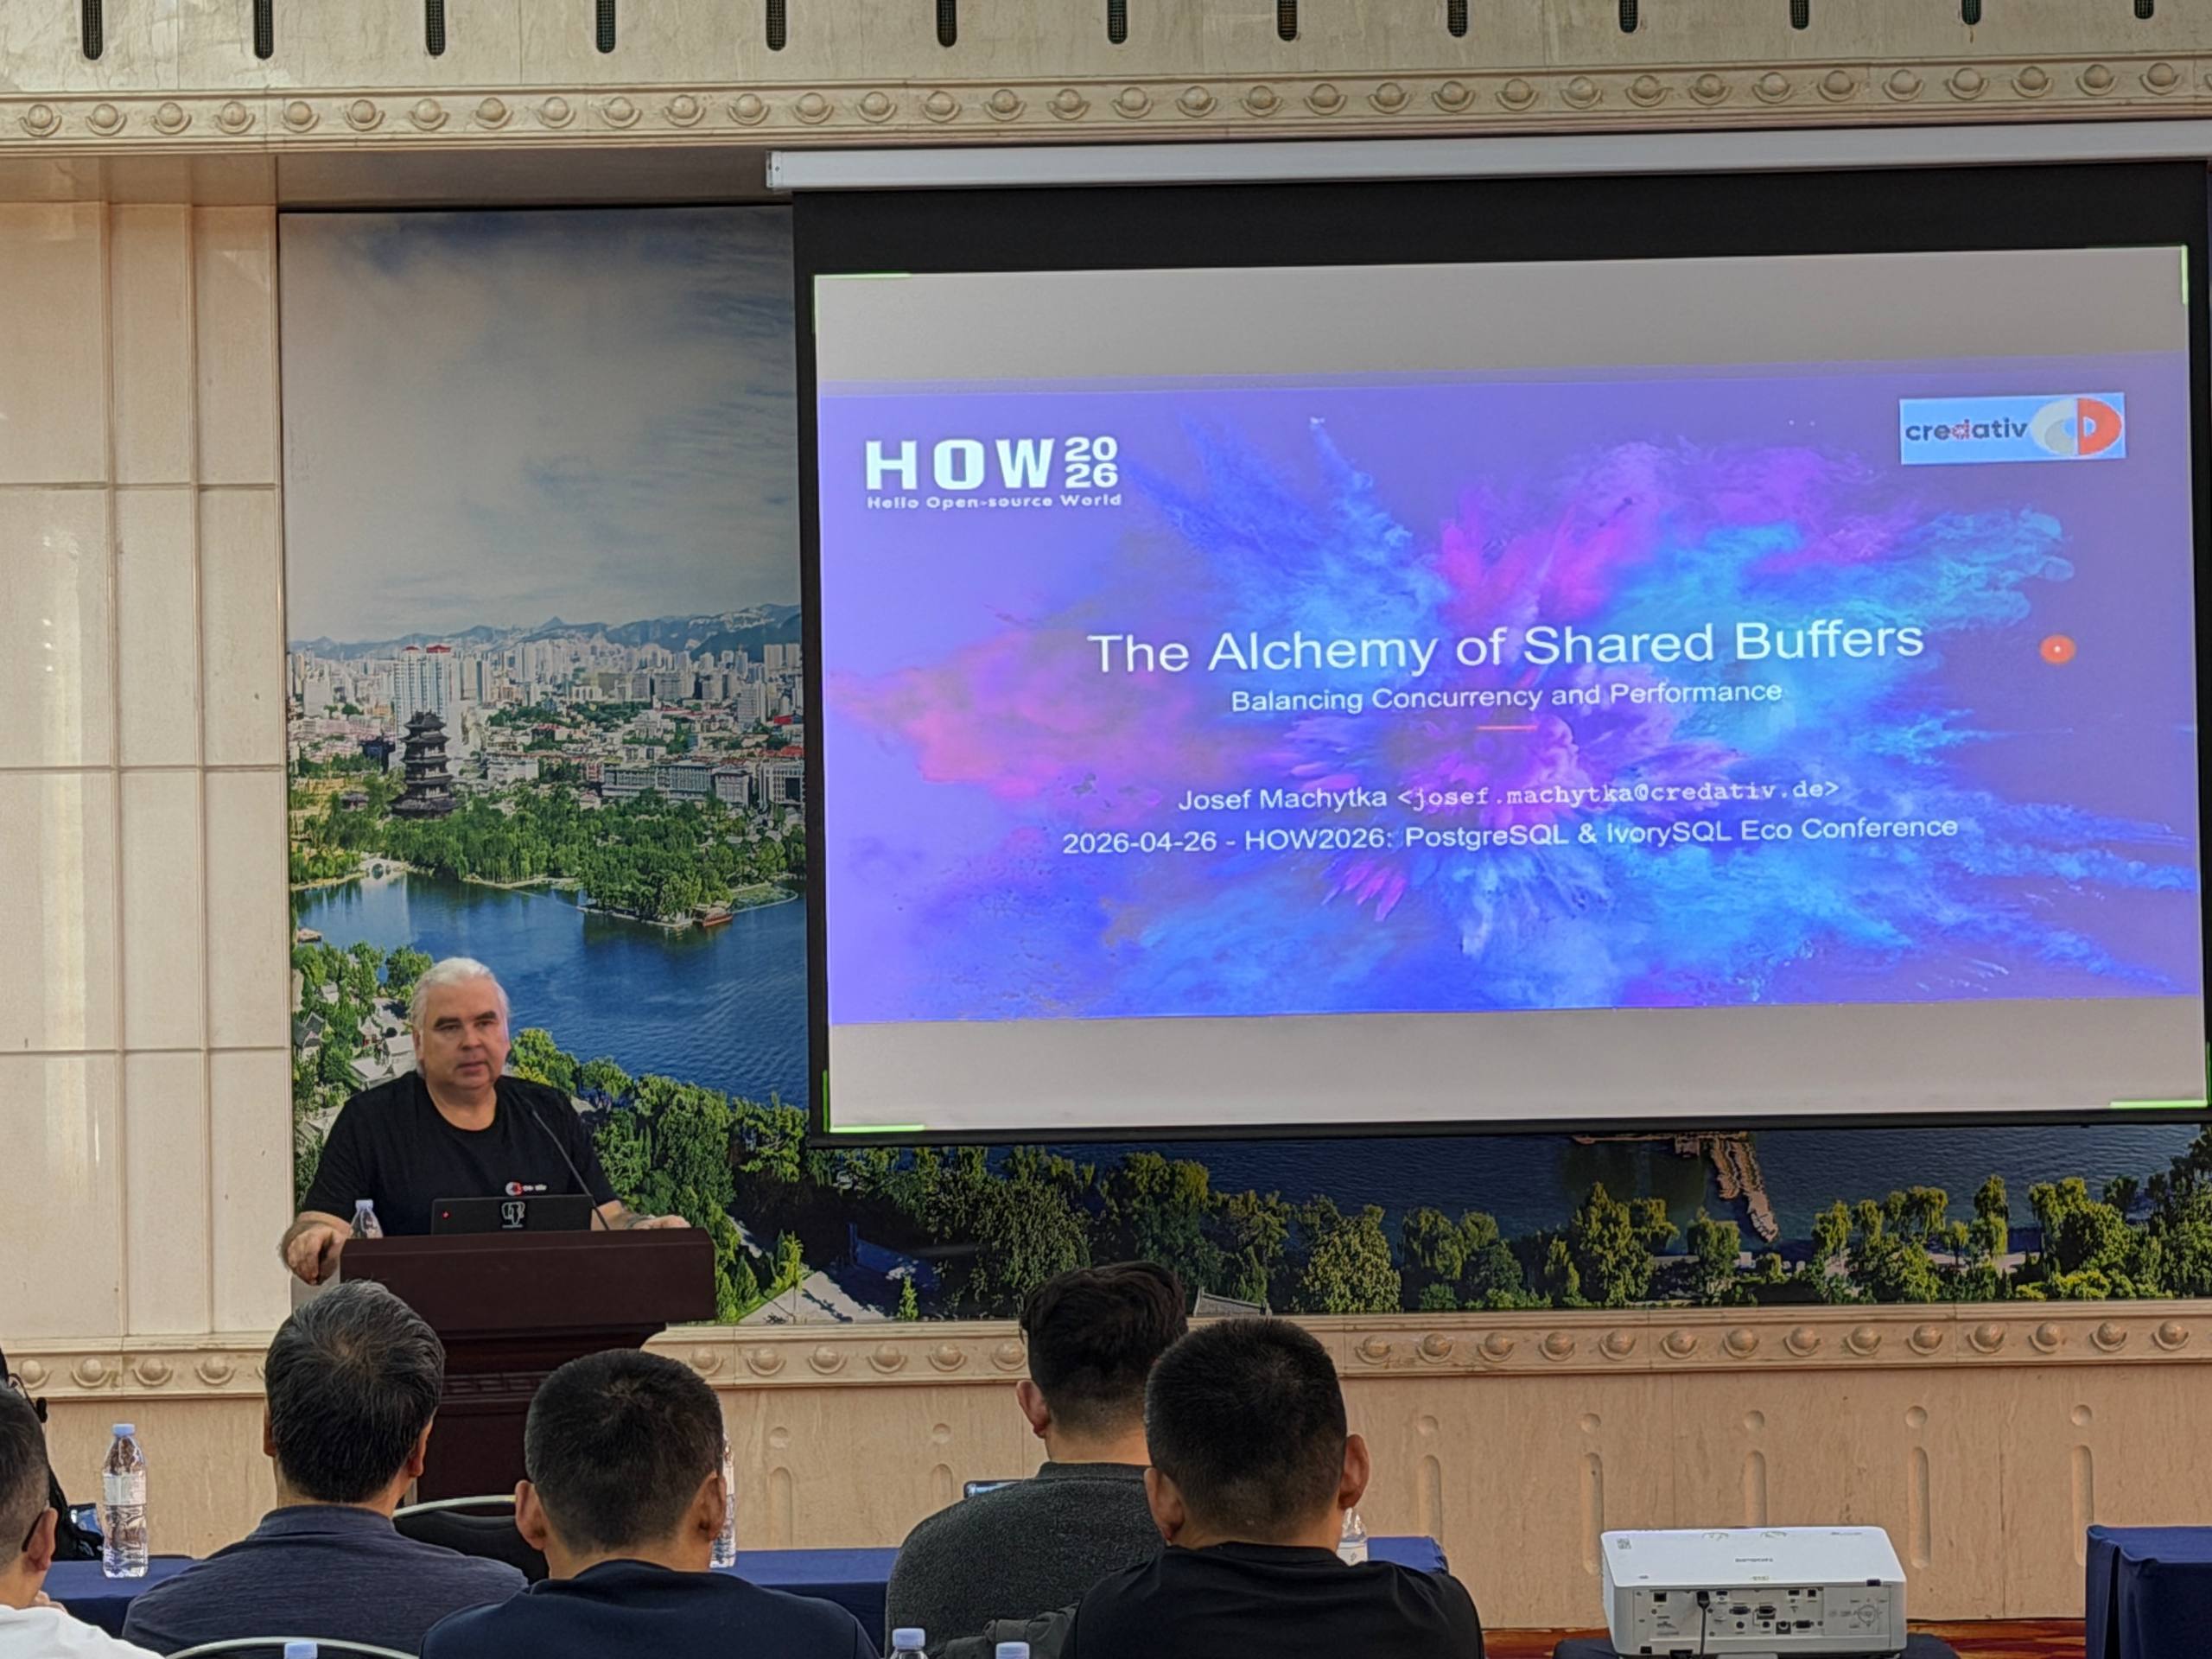
Workshop: The Alchemy of Shared Buffers
On Sunday afternoon, I led a three-hour deep-dive workshop exploring the intricate mechanics of PostgreSQL shared buffers. I discussed how Linux implements shared memory operations through the tmpfs file system, how shared buffers work internally, their practical limitations and usage patterns, why and how huge pages should be used for their allocation, why transparent huge pages negatively affect performance, and practical strategies for balancing high concurrency with optimal system performance.
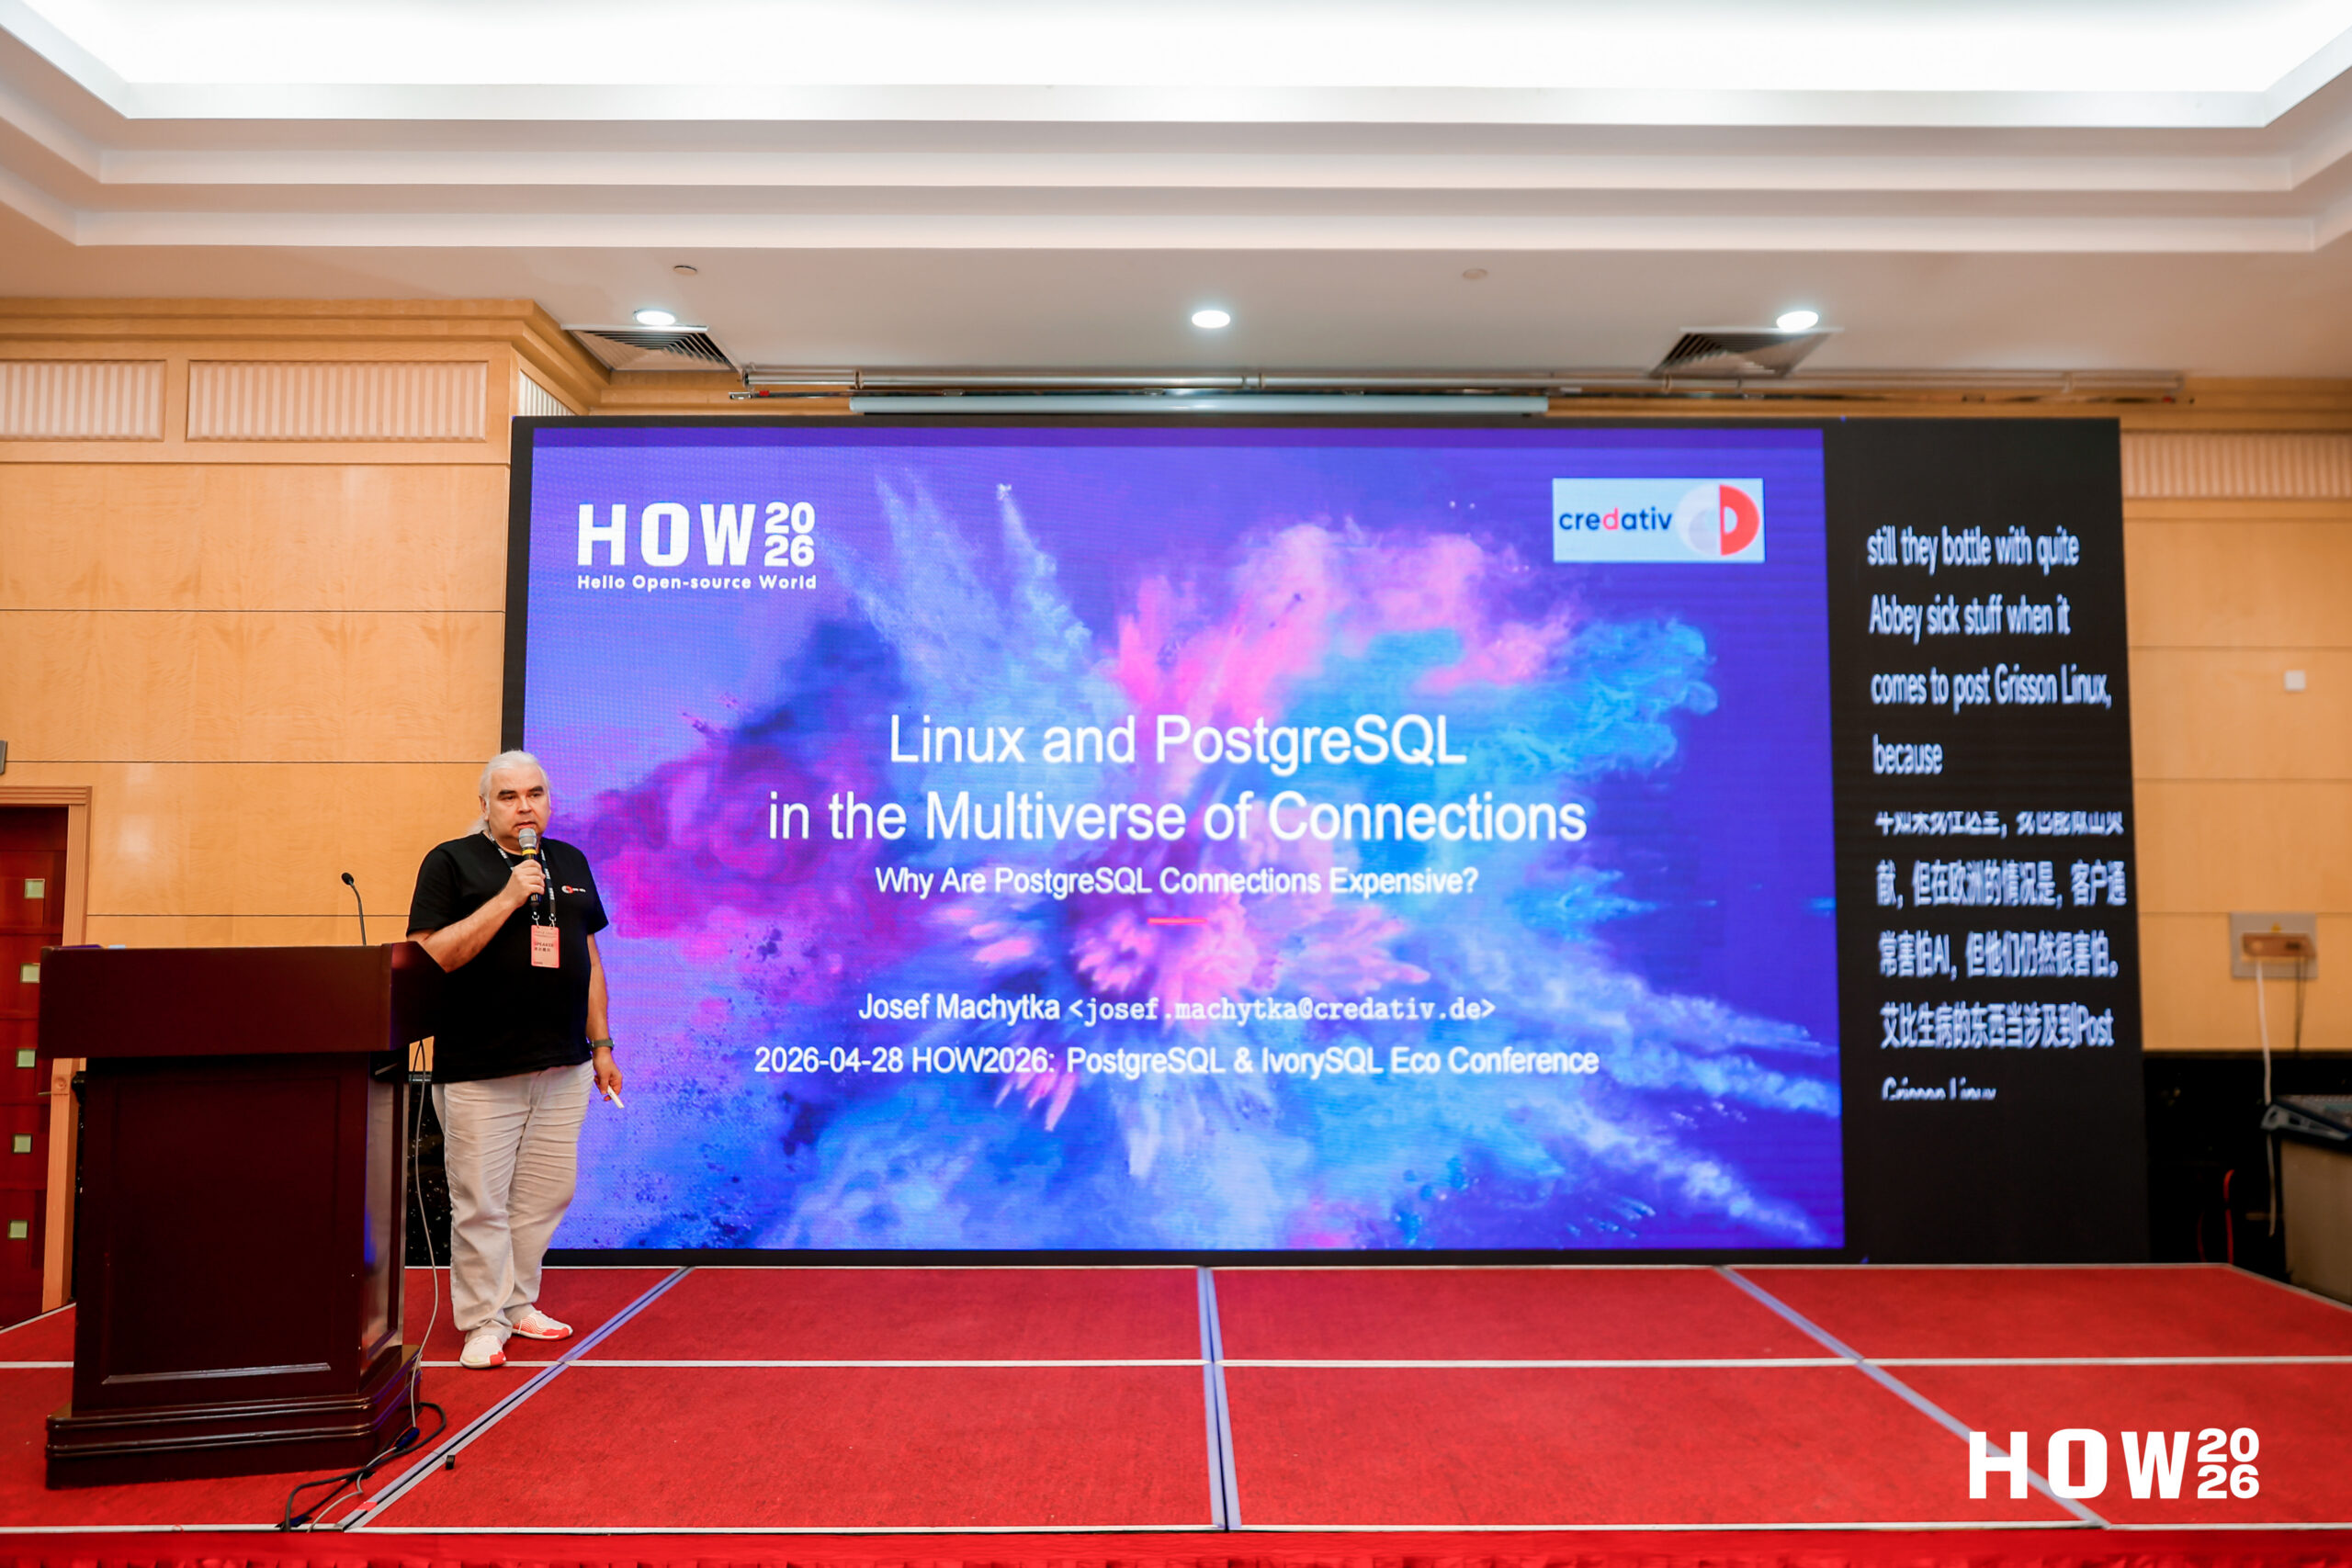
Talk: Linux and PostgreSQL in the Multiverse of Connections
On Tuesday afternoon, I gave a talk focused on PostgreSQL connection overhead. I discussed how PostgreSQL connections interact with the Linux kernel, covering memory usage, physical memory allocation mapping, context-switching overhead, and PostgreSQL internals to explain why large numbers of connections can significantly degrade performance.

Selected Highlights from the Conference
- The Development Trends of Databases in the Era of Data Intelligence — Aoying Zhou opened the event with his perspective on the future direction of database architectures in a data-driven era shaped by Artificial Intelligence. He discussed how tighter integration between databases and AI technologies will be one of the major drivers of future technological advancement.
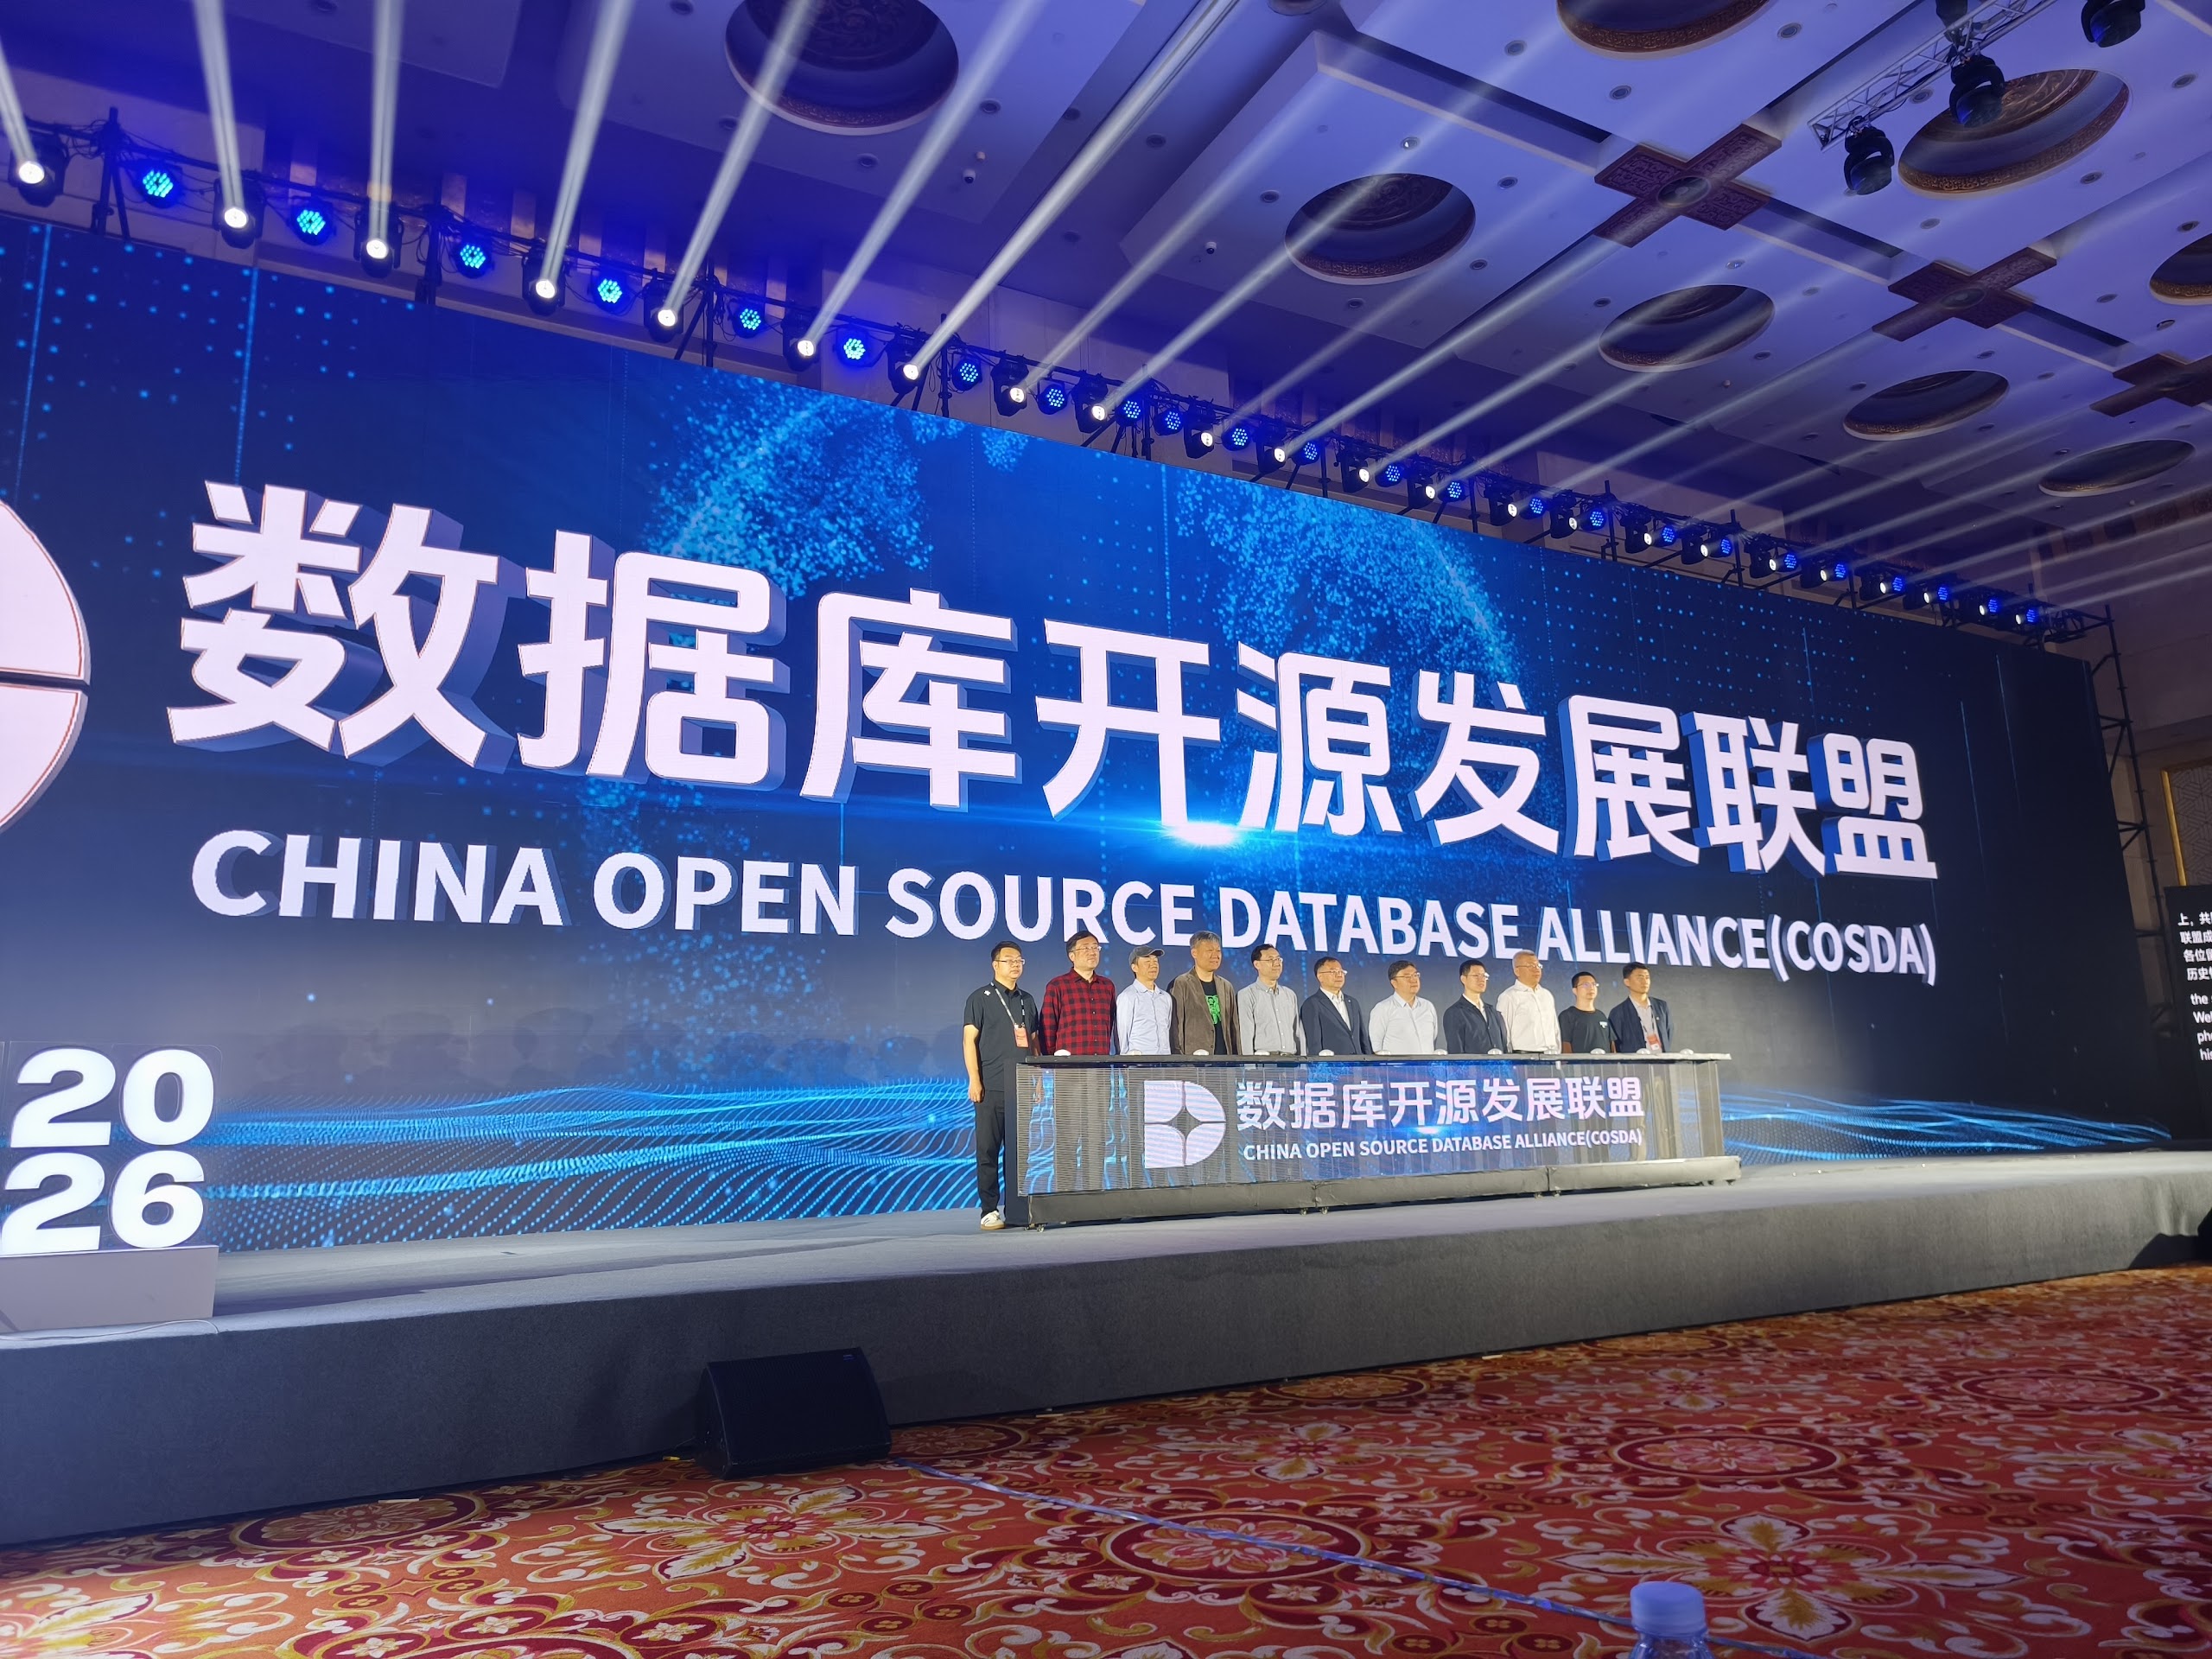
- Inauguration Ceremony of COSDA & China’s PostgreSQL Industry — We witnessed the official inauguration of the China Open Source Database Alliance (COSDA), followed by a strategic overview from Zhongyi Tan covering opportunities and the future roadmap for PostgreSQL in China. Chinese companies see significant potential in PostgreSQL and IvorySQL as widely deployable open-source database solutions that can also be offered internationally.
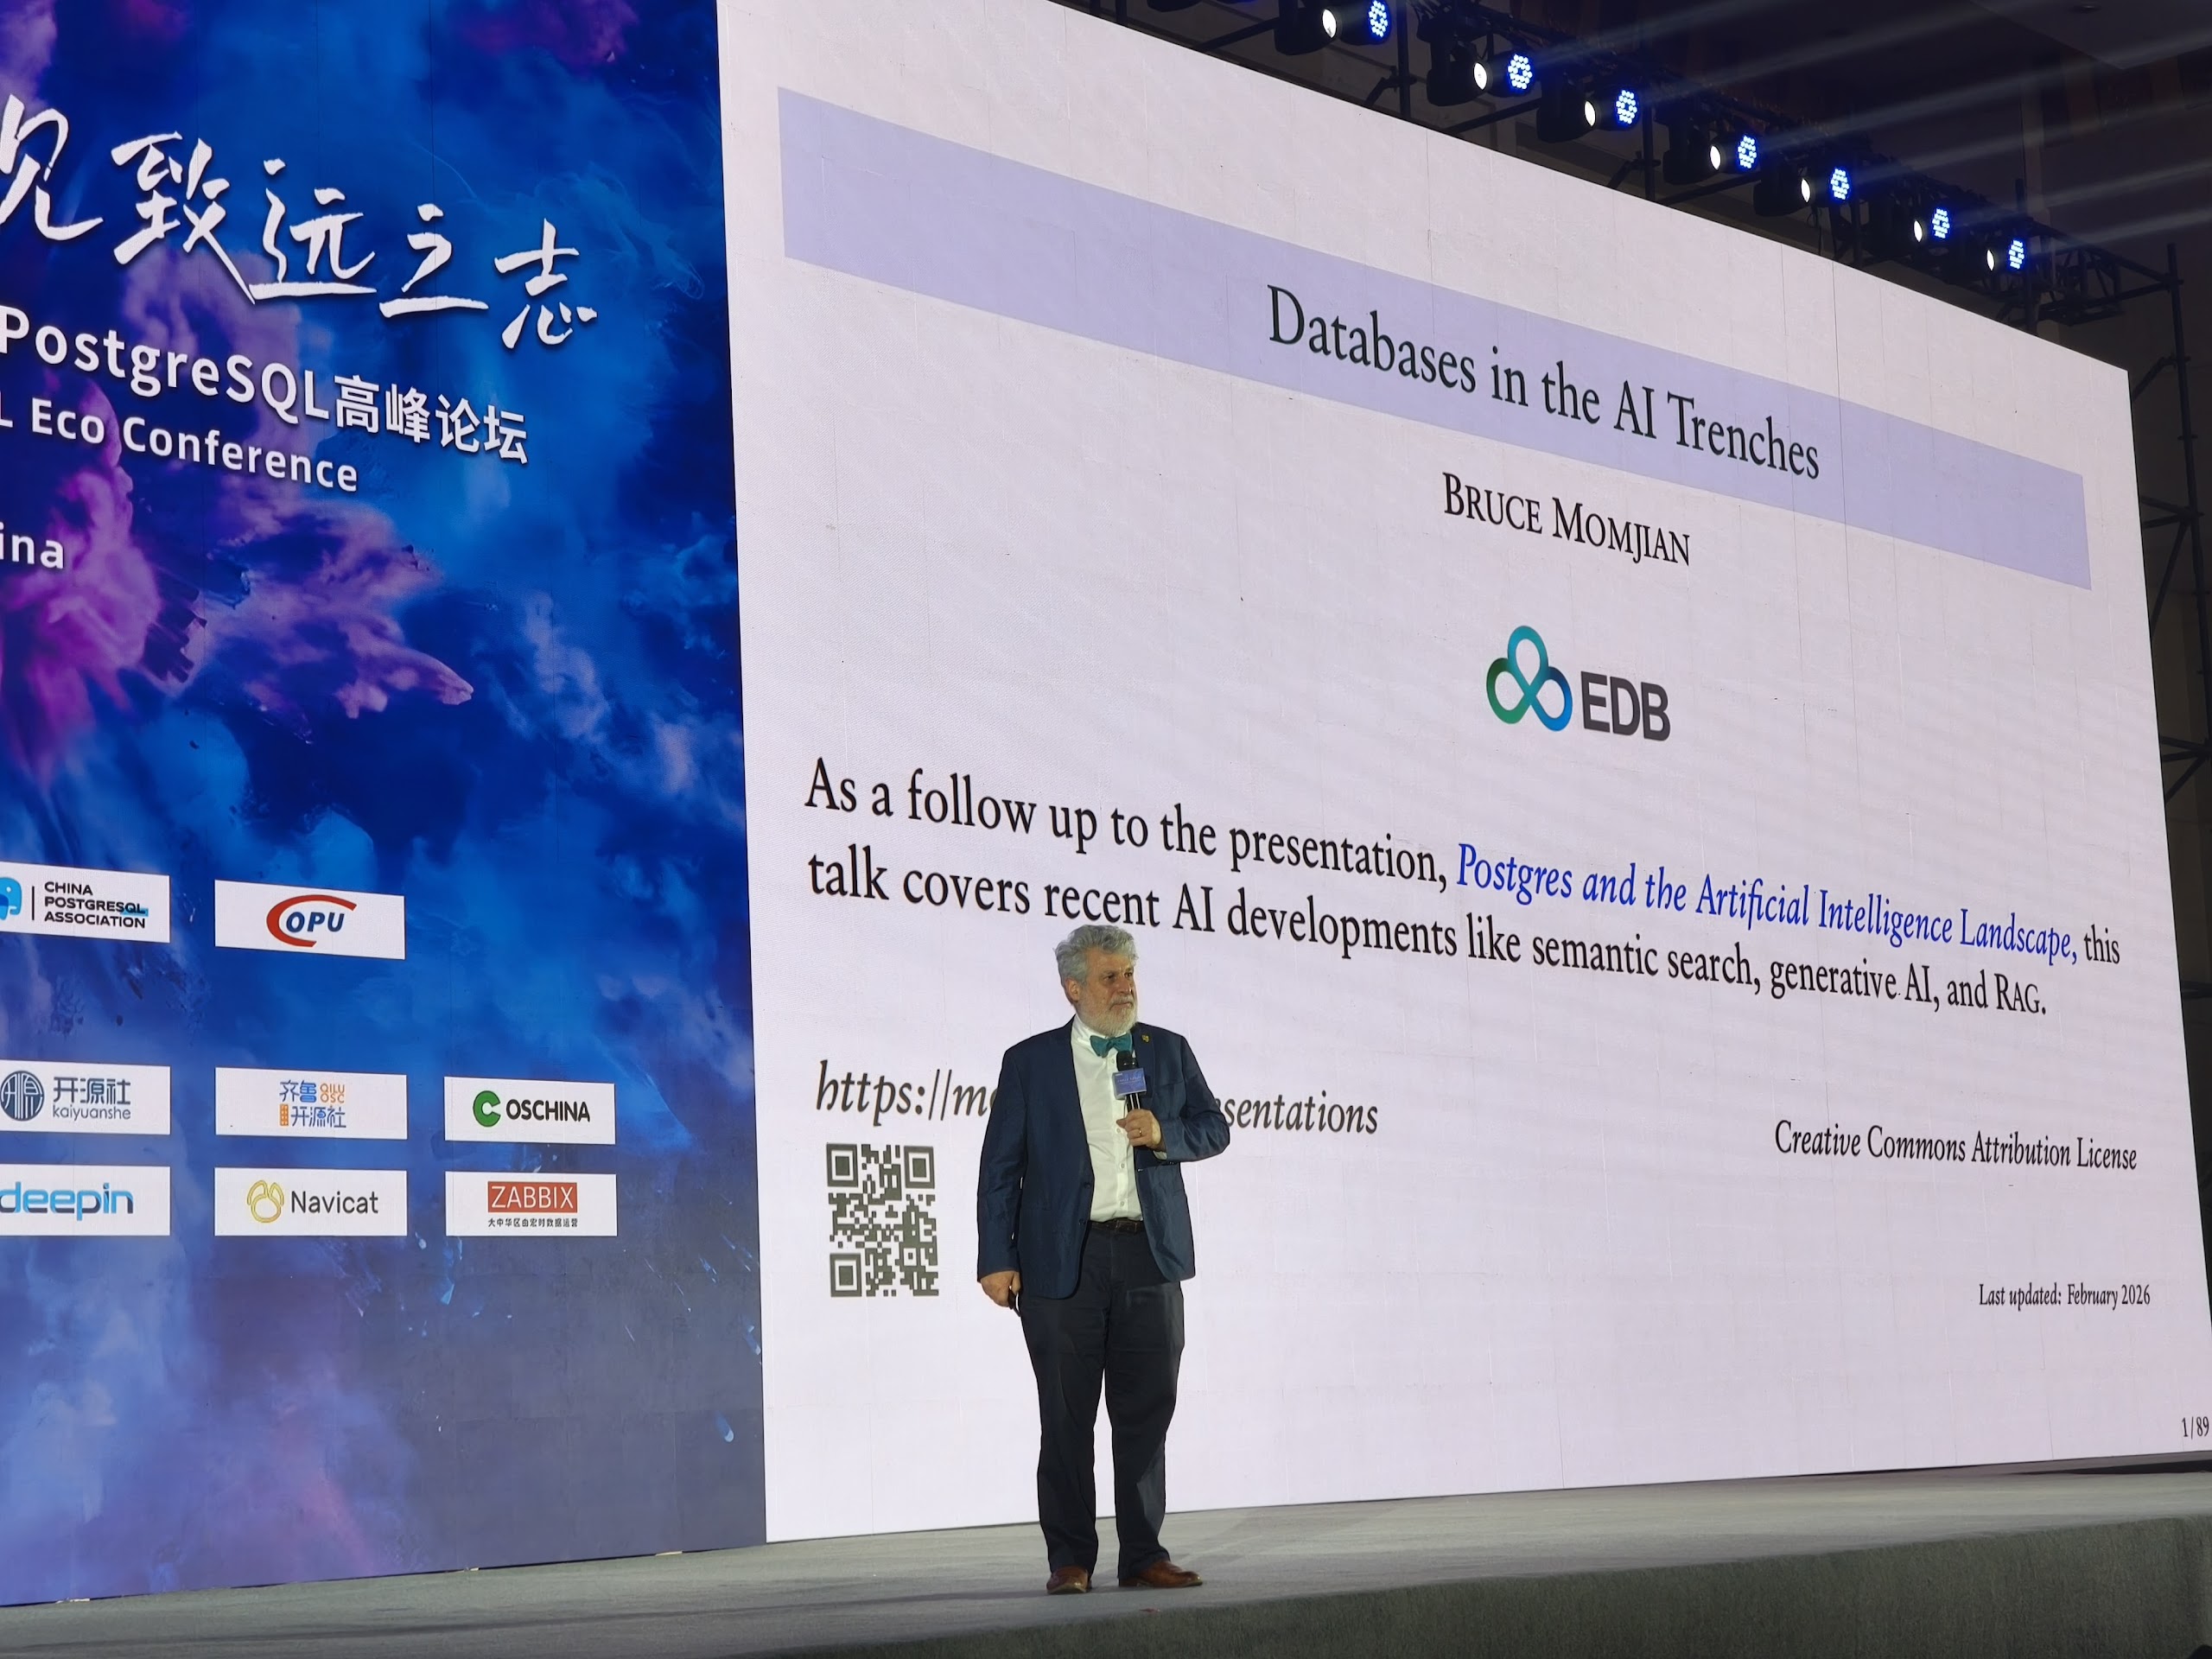
- Databases in the AI Trenches — Bruce Momjian delivered an insightful keynote on how PostgreSQL is adapting to the rapidly evolving demands of AI workloads.
- Open-Source Foundation, Boundless Intelligence Connection — Xinjie Lv highlighted the critical role that open-source communities play as the foundation for modern intelligent applications and platforms.
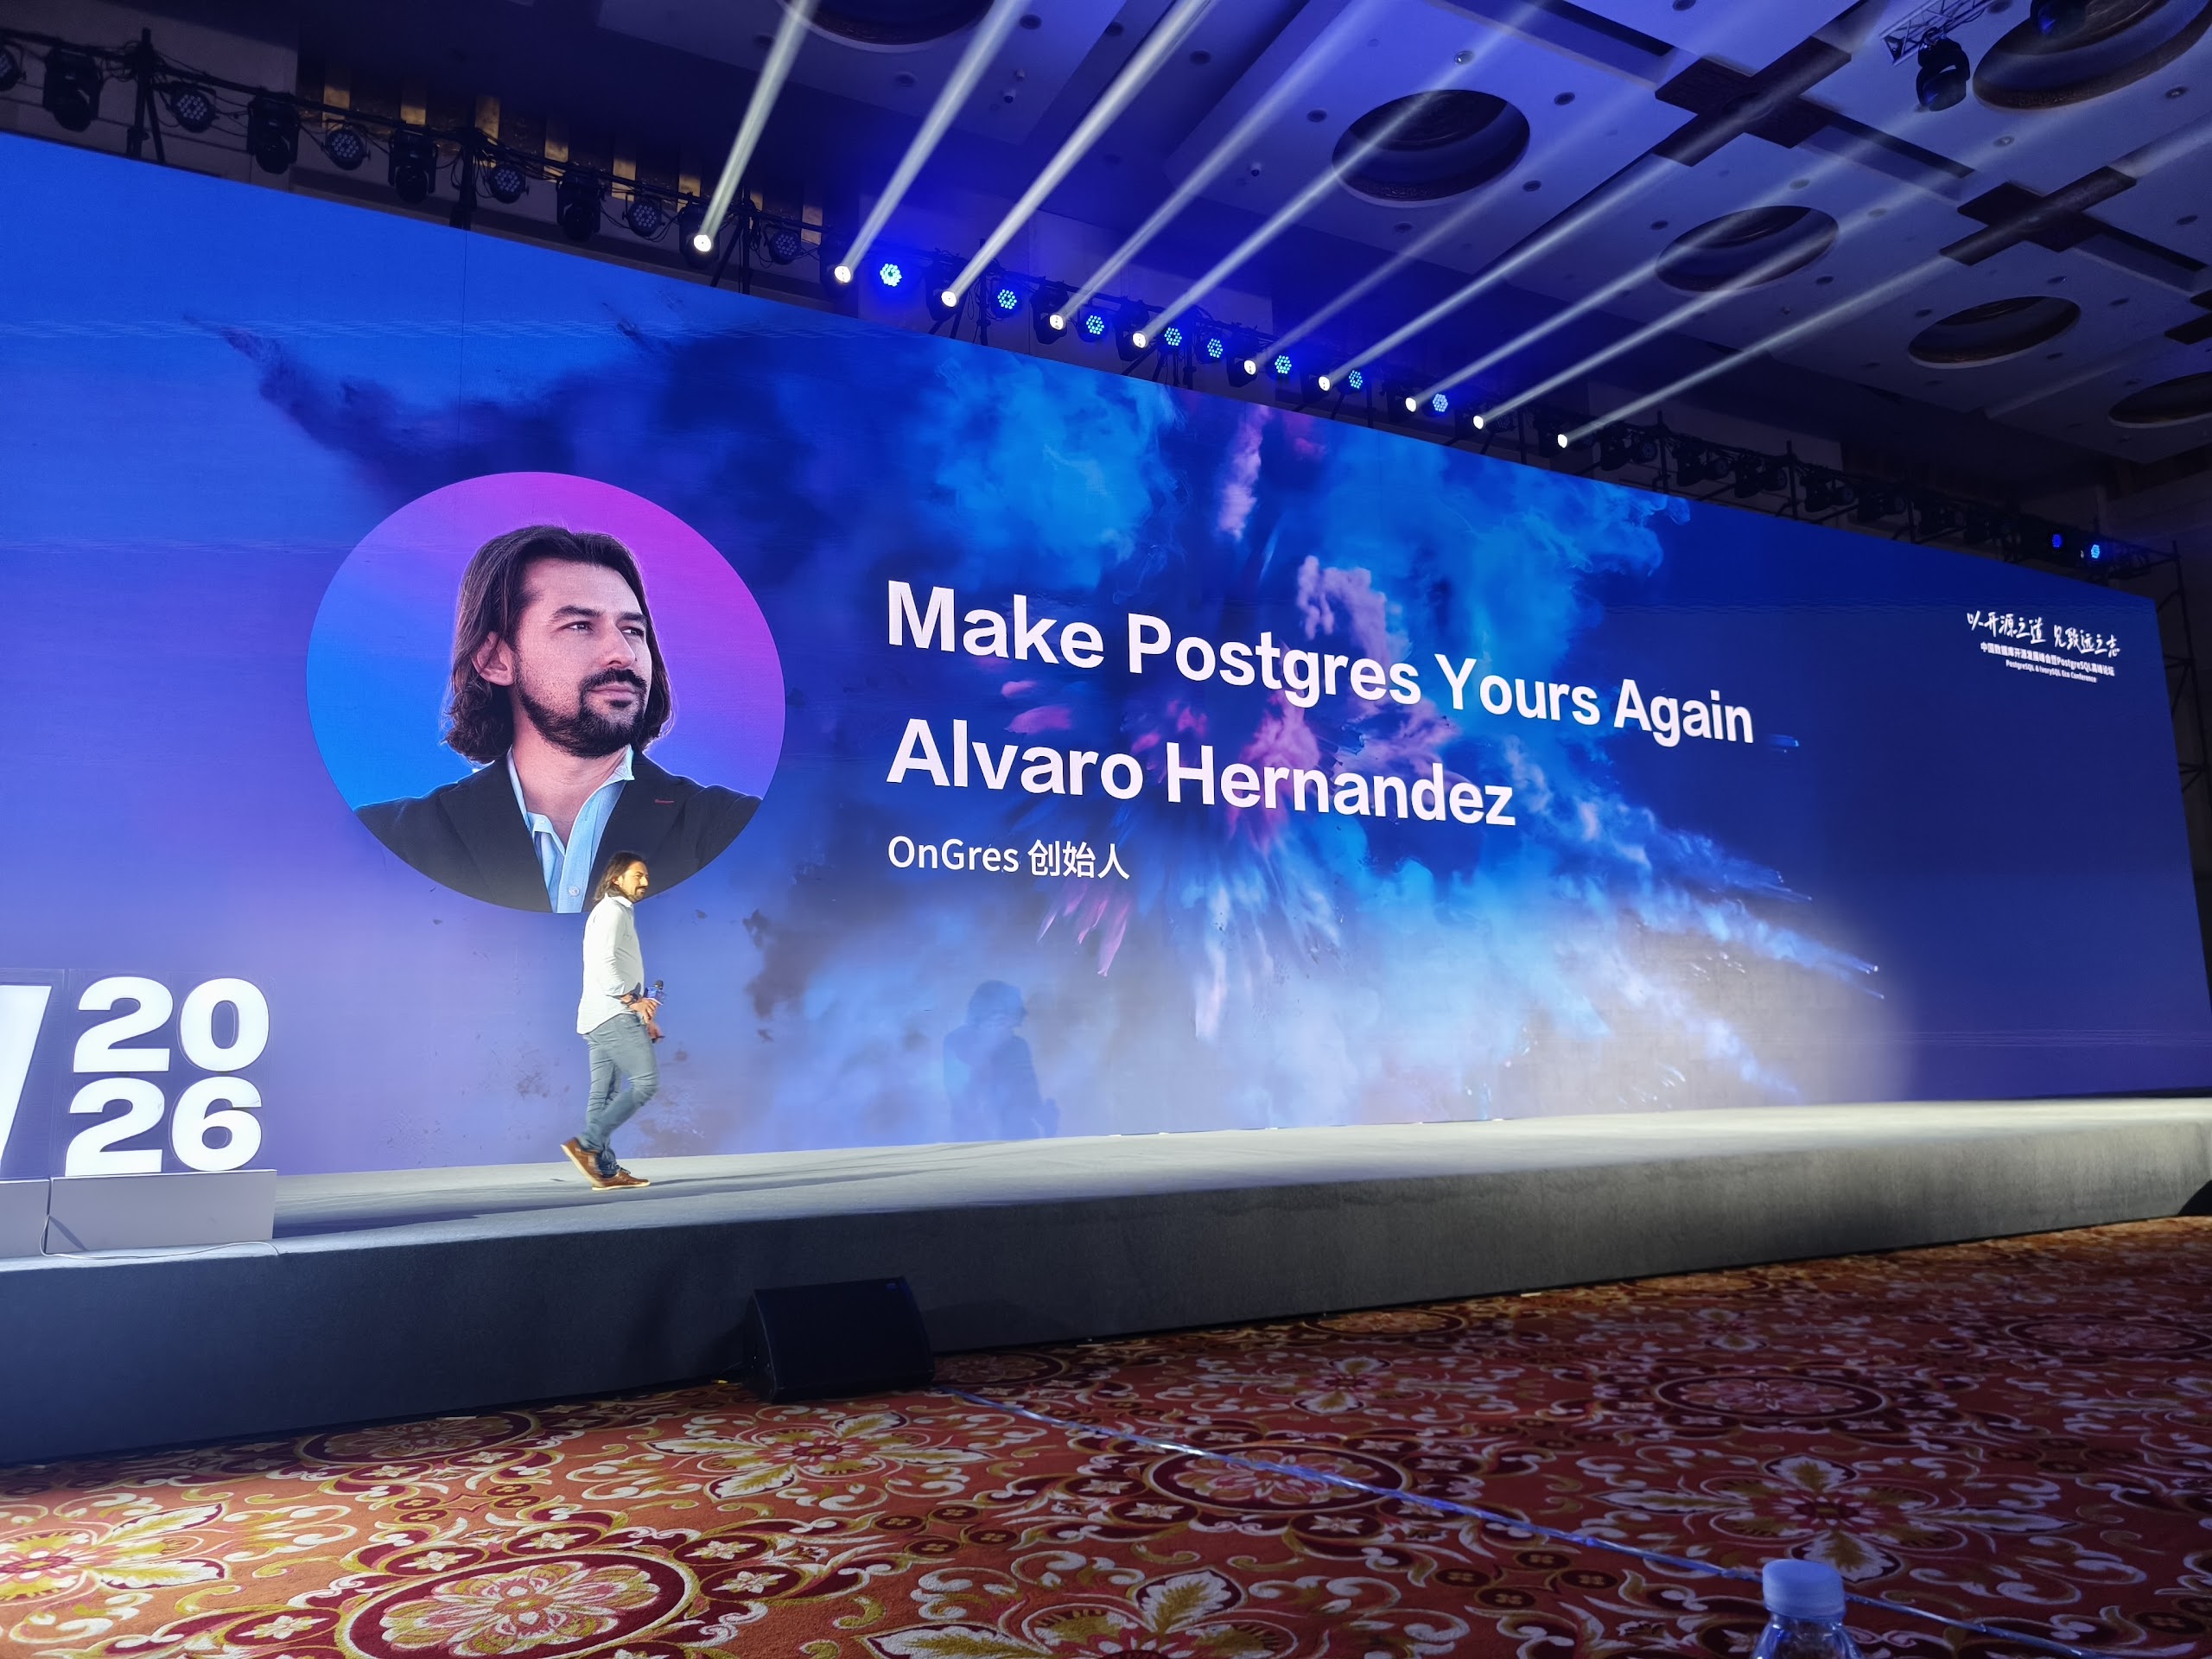
- Make Postgres Yours Again — Alvaro Hernandez presented an inspiring talk on PostgreSQL extensibility and on regaining operational control of database deployments through a new open-source deployment environment developed by his company.
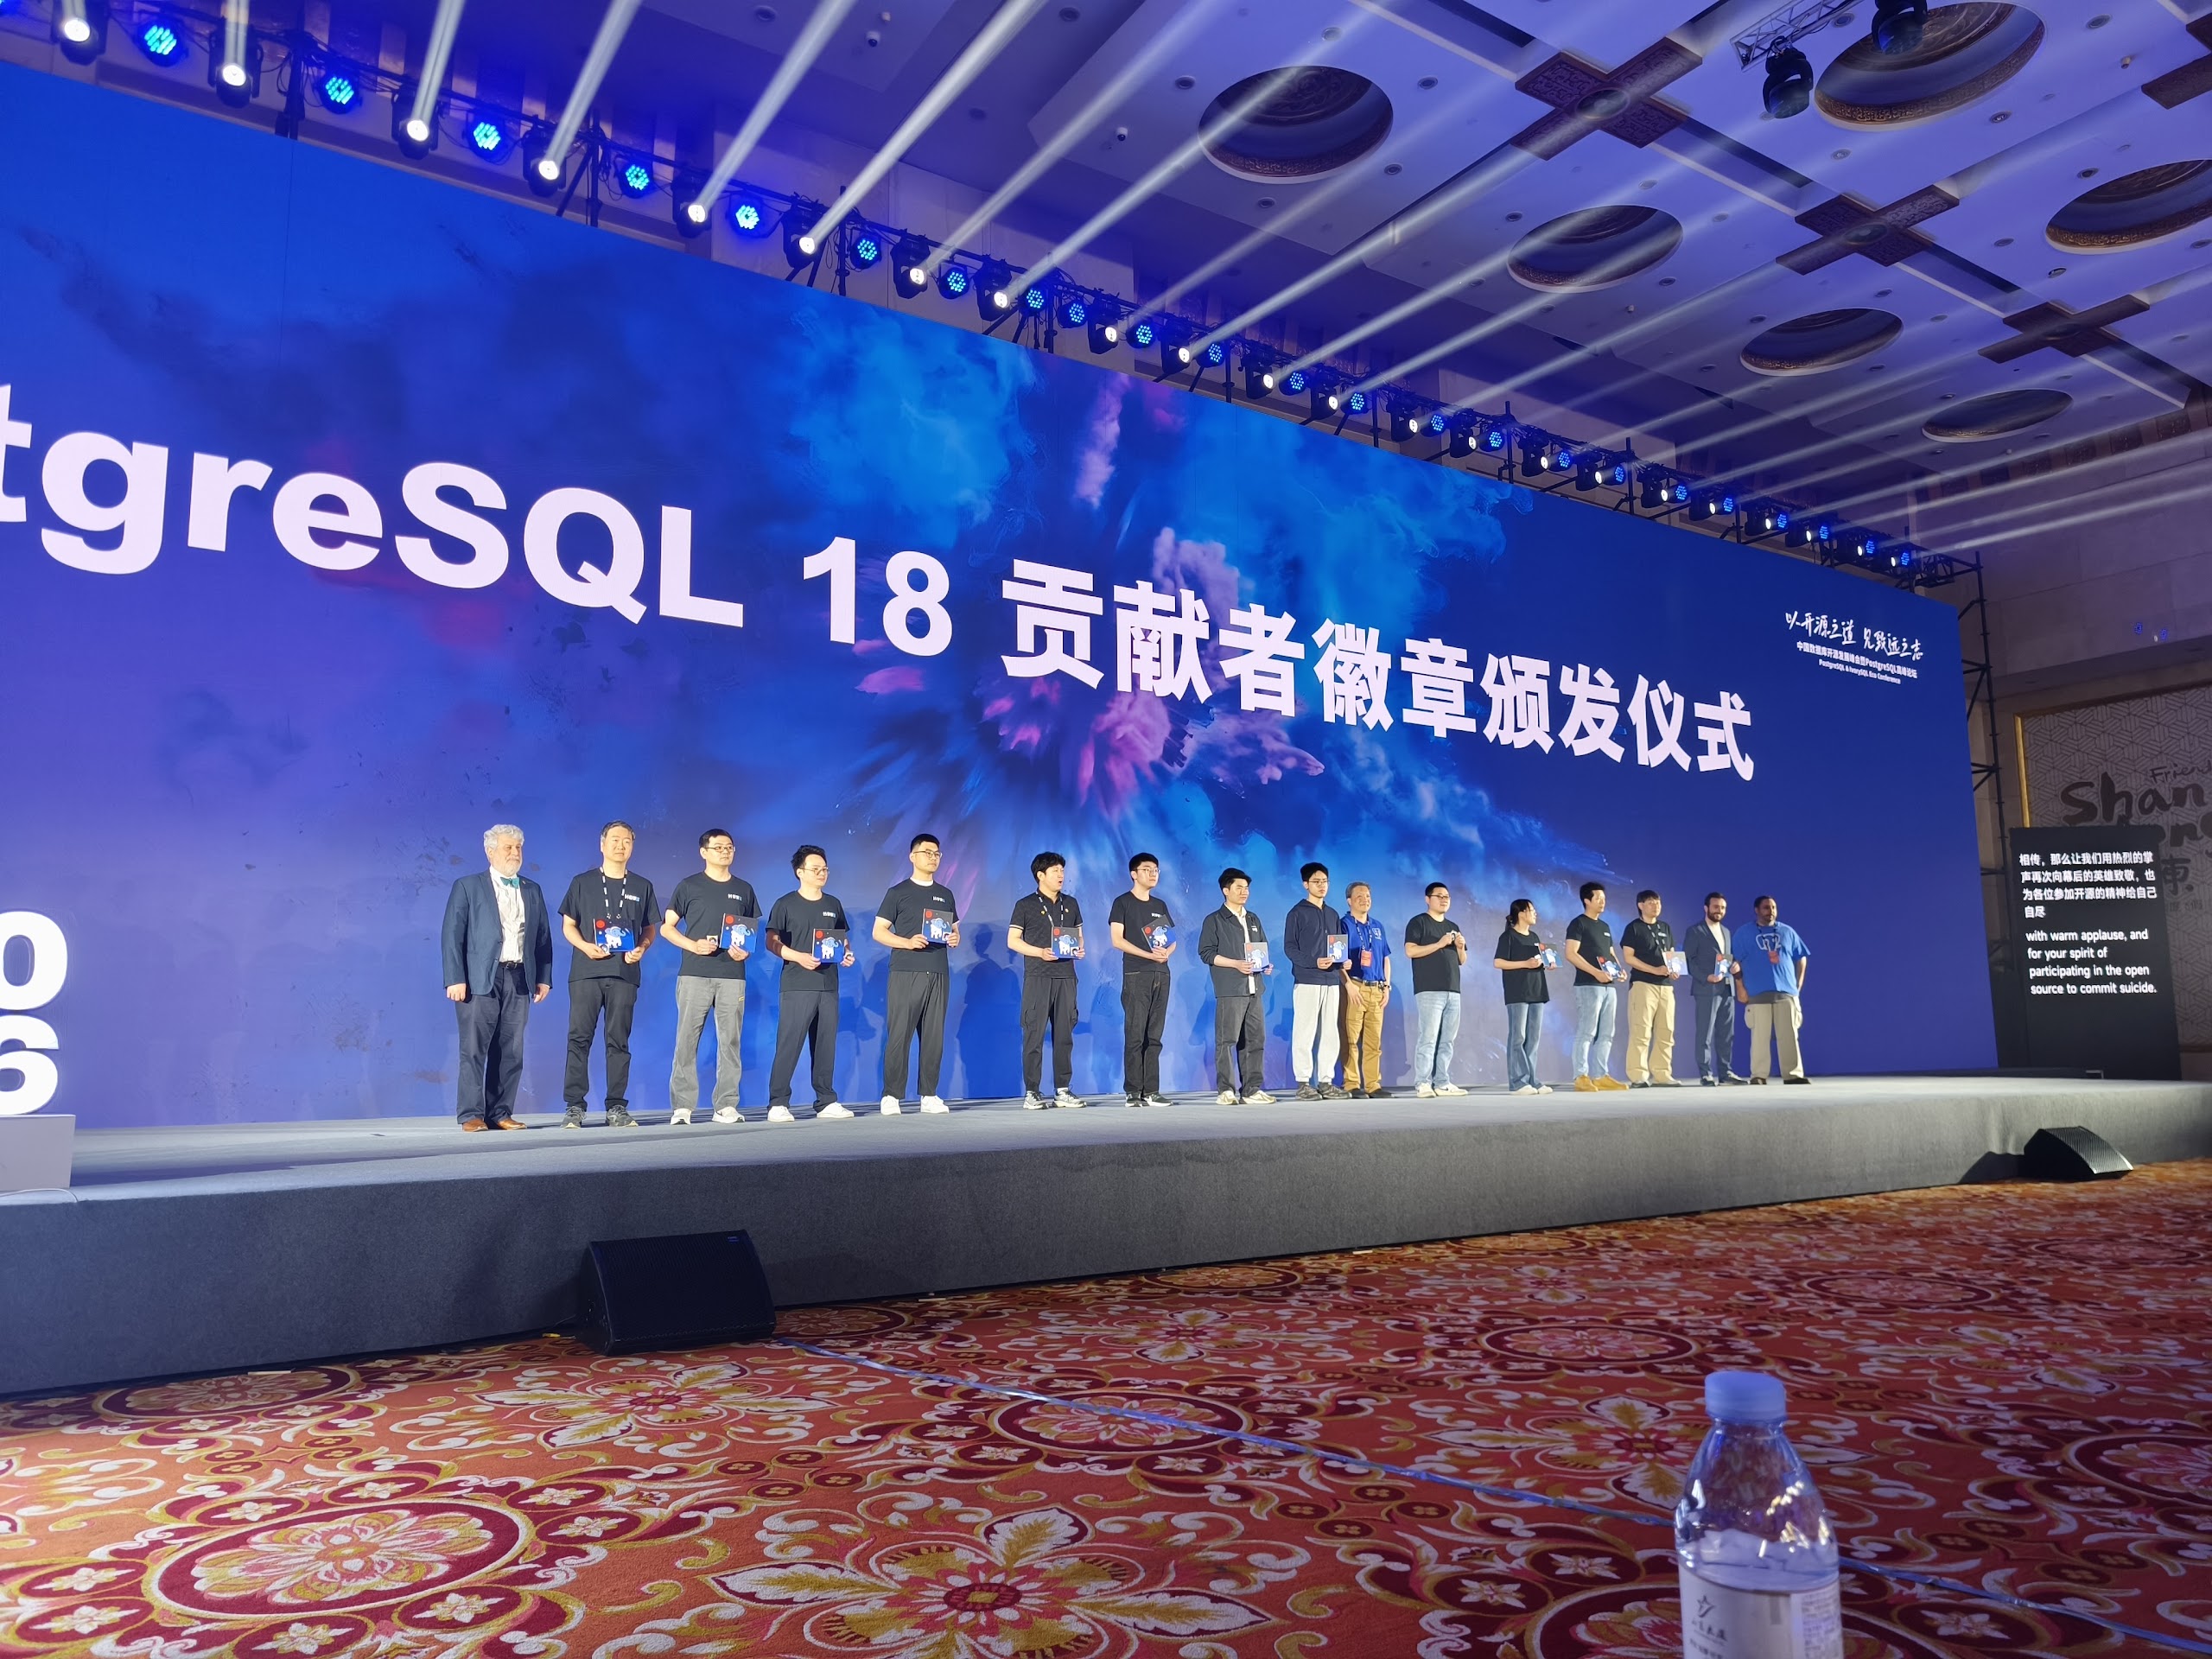
- Community Exhibitions & Awards — The morning concluded with Robert Treat and Mark Wong explaining how PostgreSQL conferences and community events are organized, together with ways to become involved in the PostgreSQL ecosystem. This was followed by a special Badge Award Ceremony recognizing contributors who worked on PostgreSQL 18.

Databases and AI
- AI Breakout Year: What Can IvorySQL Do? (Shawn Yan) — An overview of the practical applications and capabilities of IvorySQL for supporting AI-oriented workloads.
- Applications and Practices of PostgreSQL in AI (Dingding Wang) — This talk focused on leveraging PostgreSQL and its ecosystem to build efficient and cost-effective AI data pipelines and intelligent applications.
- AI Performance Analysis of the PostgreSQL Database (Shan Bai) and AI-Driven Query Optimization: Tree Transformer Breakthrough (Peng Cui) — These sessions were highly technical. Shan Bai demonstrated the use of AI techniques for general query optimization, while Peng Cui introduced QPR (Tree Transformer Representation) for multi-dimensional feature extraction and QPSLR (Ranking Learning) for ranking-based query optimization.
- AI-Native PG Diagnosis (Xiang Zheng) — A presentation focused on operational aspects of PostgreSQL, showcasing a transition from reactive diagnostics performed manually by administrators toward AI-native systems capable of proactively identifying problems.
- PostgreSQL in AI Applications: Reality Is More Complex Than Similarity Search (Florents Tselai) — A very practical talk highlighting that while pgvector and similarity search are valuable technologies, real-world AI applications require significantly broader and more sophisticated data modeling approaches.


Other Interesting Talks
- PostgreSQL Hacker: My Experience and Lessons (Chao Li) — A candid reflection on Chao Li’s first year as a PostgreSQL contributor. Rather than focusing primarily on tools, the talk explored early misunderstandings, technical and communication mistakes, and the strategies that helped overcome the perceived barriers to entry, offering valuable guidance for new contributors interested in joining the PostgreSQL community.
- Tracking Vacuum Resource Consumption: From Idea to Patch (Alena Rybakina) — An insightful presentation describing the architectural journey behind developing per-relation vacuum resource statistics in PostgreSQL. The talk demonstrated how strict internal constraints influenced key design decisions and provided valuable lessons about balancing observability with performance overhead in complex subsystems.
- Zabbix 7.0 PostgreSQL Monitoring Configuration (Yong Ren) — A highly practical session covering the latest features of Zabbix 7.0 and how to configure it effectively for PostgreSQL monitoring. The presentation covered essential metrics, anomaly alerting, monitoring of connection health, replication lag, hardware utilization, and strategies for maintaining high availability.
Conclusion
HOW2026 was an unforgettable experience. Jinan was a great host city, and the depth of knowledge shared by the PostgreSQL and IvorySQL communities was truly impressive. Many thanks to the organizers for the invitation and for the excellent organization of the conference.
Photos (c) HOW2026 organizers / Josef Machytka
PostgreSQL 18 made one very important change – data block checksums are now enabled by default for new clusters at cluster initialization time. I already wrote about it in my previous article. I also mentioned that there are still many existing PostgreSQL installations without data checksums enabled, because this was the default in previous versions. In those installations, data corruption can sometimes cause mysterious errors and prevent normal operational functioning. In this post, I want to dissect common PostgreSQL data corruption modes, to show how to diagnose them, and sketch how to recover from them.
Corruption in PostgreSQL relations without data checksums surfaces as low-level errors like “invalid page in block xxx”, transaction ID errors, TOAST chunk inconsistencies, or even backend crashes. Unfortunately, some backup strategies can mask the corruption. If the cluster does not use checksums, then tools like pg_basebackup, which copy data files as they are, cannot perform any validation of data, so corrupted pages can quietly end up in a base backup. If checksums are enabled, pg_basebackup verifies them by default unless –no-verify-checksums is used. In practice, these low-level errors often become visible only when we directly access the corrupted data. Some data is rarely touched, which means corruption often surfaces only during an attempt to run pg_dump — because pg_dump must read all data.
Typical errors include:
-- invalid page in a table:
pg_dump: error: query failed: ERROR: invalid page in block 0 of relation base/16384/66427
pg_dump: error: query was: SELECT last_value, is_called FROM public.test_table_bytea_id_seq

-- damaged system columns in a tuple:
pg_dump: error: Dumping the contents of table "test_table_bytea" failed: PQgetResult() failed.
pg_dump: error: Error message from server: ERROR: could not access status of transaction 3353862211
DETAIL: Could not open file "pg_xact/0C7E": No such file or directory.
pg_dump: error: The command was: COPY public.test_table_bytea (id, id2, id3, description, data) TO stdout;

-- damaged sequence:
pg_dump: error: query to get data of sequence "test_table_bytea_id2_seq" returned 0 rows (expected 1)

-- memory segmentation fault during pg_dump:
pg_dump: error: Dumping the contents of table "test_table_bytea" failed: PQgetCopyData() failed.
pg_dump: error: Error message from server: server closed the connection unexpectedly
This probably means the server terminated abnormally
before or while processing the request.
pg_dump: error: The command was: COPY public.test_table_bytea (id, id2, id3, description, data) TO stdout;
Note: in such cases, unfortunately pg_dump exits on the first error and does not continue. But we can use a simple script which, in a loop, reads table names from the database and dumps each table separately into a separate file, with redirection of error messages into a table-specific log file. This way we both back up tables which are still intact and find all corrupted objects.
Understanding errors
The fastest way to make sense of those symptoms is to map them back to which part of an 8 KB heap page is damaged. To be able to test it, I created a “corruption simulator” Python script which can surgically damage specific parts of a data block. Using it we can test common corruption modes. We will see how to diagnose each with pageinspect, look if amcheck can help in these cases, and show how to surgically unblock queries with pg_surgery when a single tuple makes an entire table unreadable.
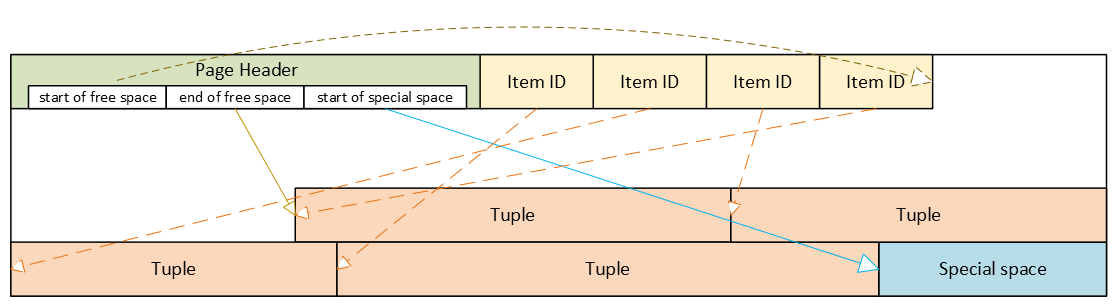
PostgreSQL heap table format
- Header: metadata for block management and integrity
- Item ID (tuple pointer) array: entries pointing to tuples (offset + length + flags)
- Free space
- Tuples: actual row data, each with its own tuple header (system columns)
- Special space: reserved for index-specific or other relation-specific data – heap tables do not use it
Corrupted page header: the whole block becomes inaccessible
The page header contains the layout pointers for the page. The most important fields, which we can also see via pageinspect are:
- pd_flags: header flag bits
- pd_lower: offset to the start of free space
- pd_upper: offset to the end of free space
- pd_special: offset to the start of special space
- plus lsn, checksum, pagesize, version, prune_xid
ERROR: invalid page in block 285 of relation base/16384/29724
This is the only class of corruption error that can be skipped by enabling zero_damaged_pages = on when the cluster does not use data block checksums. With zero_damaged_pages = on, blocks with corrupted headers are “zeroed” in memory and skipped, which literally means the whole content of the block is replaced with zeros. AUTOVACUUM removes zeroed pages, but cannot zero out unscanned pages.
Where the error comes from in PostgreSQL source code
/*
* The following checks don't prove the header is correct, only that
* it looks sane enough to allow into the buffer pool. Later usage of
* the block can still reveal problems, which is why we offer the
* checksum option.
*/

if ((p->pd_flags & ~PD_VALID_FLAG_BITS) == 0 &&
    p->pd_lower <= p->pd_upper &&
    p->pd_upper <= p->pd_special &&
    p->pd_special <= BLCKSZ &&
    p->pd_special == MAXALIGN(p->pd_special))
    header_sane = true;

if (header_sane && !checksum_failure)
    return true;
SELECT * FROM page_header(get_raw_page('pg_toast.pg_toast_32840', 100));

     lsn    | checksum | flags | lower | upper | special | pagesize | version | prune_xid
------------+----------+-------+-------+-------+---------+----------+---------+-----------
0/2B2FCD68 | 0 | 4 | 40 | 64 | 8192 | 8192 | 4 | 0If the header is tested as corrupted, we cannot diagnose anything using SQL. With zero_damaged_pages = off any attempt to read this page ends with an error similar to the example shown above. If we set zero_damaged_pages = on then on the first attempt to read this page everything is replaced with all zeroes, including the header:
SELECT * from page_header(get_raw_page('pg_toast.pg_toast_28740', 578));
WARNING: invalid page in block 578 of relation base/16384/28751; zeroing out page

 lsn | checksum | flags | lower | upper | special | pagesize | version | prune_xid
-----+----------+-------+-------+-------+---------+----------+---------+-----------
 0/0 |        0 |     0 |     0 |     0 |       0 |        0 |       0 |         0
Corrupted Item IDs array: offsets and lengths become nonsense
- ERROR: invalid memory alloc request size 18446744073709551594
- DEBUG: server process (PID 76) was terminated by signal 11: Segmentation fault
SELECT lp, lp_off, lp_flags, lp_len, t_xmin, t_xmax, t_field3, t_ctid, t_infomask2, t_infomask, t_hoff, t_bits, t_oid, substr(t_data::text,1,50) as t_data
FROM heap_page_items(get_raw_page('public.test_table', 7));

 lp | lp_off | lp_flags | lp_len | t_xmin | t_xmax | t_field3 | t_ctid | t_infomask2 | t_infomask | t_hoff | t_bits | t_oid | t_data
----+--------+----------+--------+--------+--------+----------+--------+-------------+------------+--------+--------+-------+----------------------------------------------------
  1 |   7936 |        1 |    252 |  29475 |      0 |        0 |  (7,1) |           5 |       2310 |     24 |        |       | \x01010000010100000101000018030000486f742073656520
  2 |   7696 |        1 |    236 |  29476 |      0 |        0 |  (7,2) |           5 |       2310 |     24 |        |       | \x020100000201000002010000d802000043756c747572616c
  3 |   7504 |        1 |    189 |  29477 |      0 |        0 |  (7,3) |           5 |       2310 |     24 |        |       | \x0301000003010000030100001c020000446f6f7220726563
  4 |   7368 |        1 |    132 |  29478 |      0 |        0 |  (7,4) |           5 |       2310 |     24 |        |       | \x0401000004010000040100009d4d6f76656d656e74207374
Here we can nicely see the Item IDs array – offsets and lengths. The first tuple is stored at the very end of the data block, therefore it has the biggest offset. Each subsequent tuple is stored closer and closer to the beginning of the page, so offsets are getting smaller. We can also see lengths of tuples, they are all different, because they contain a variable-length text value. We can also see tuples and their system columns, but we will look at them later.
Now, when we damage the Item IDs array and diagnose how it looks like – output is shortened because all other columns are empty as well. Due to the damaged Item IDs array, we cannot properly read tuples. Here we can immediately see the problem – offsets and lengths contain random values, the majority of them exceeding 8192, i.e. pointing well beyond data page boundaries:
 lp | lp_off | lp_flags | lp_len | t_xmin | t_xmax
----+--------+----------+--------+--------+--------
  1 |  19543 |        1 |  16226 |        |
  2 |   5585 |        2 |   3798 |        |
  3 |  25664 |        3 |  15332 |        |
  4 |  10285 |        2 |  17420 |        |
SELECT * FROM verify_heapam('test_table', FALSE, FALSE, 'none', 7, 7);

 blkno | offnum | attnum | msg
-------+--------+--------+---------------------------------------------------------------------------
     7 |      1 |        | line pointer to page offset 19543 is not maximally aligned
     7 |      2 |        | line pointer redirection to item at offset 5585 exceeds maximum offset 4
     7 |      4 |        | line pointer redirection to item at offset 10285 exceeds maximum offset 4
Corrupted tuples: system columns can break scans
- 58P01 – could not access status of transaction 3047172894
- XX000 – MultiXactId 1074710815 has not been created yet — apparent wraparound
- WARNING: Concurrent insert in progress within table “test_table”
 lp | lp_off | lp_flags | lp_len |   t_xmin   |   t_xmax   |  t_field3  |       t_ctid       | t_infomask2 | t_infomask | t_hoff | t_bits | t_oid
----+--------+----------+--------+------------+------------+------------+--------------------+-------------+------------+--------+--------+-------
  1 |   6160 |        1 |   2032 | 1491852297 |  287039843 |  491133876 | (3637106980,61186) |       50867 |      46441 |    124 |        |
  2 |   4128 |        1 |   2032 | 3846288155 | 3344221045 | 2002219688 | (2496224126,65391) |       34913 |      32266 |     82 |        |
  3 |   2096 |        1 |   2032 | 1209990178 | 1861759146 | 2010821376 | (426538995,32644)  |       23049 |       2764 |    215 |        |
- XX000 – unexpected chunk number -556107646 (expected 20) for toast value 29611 in pg_toast_29580
- XX000 – found toasted toast chunk for toast value 29707 in pg_toast_29580
Dealing with corrupted tuples using pg_surgery
Even a single corrupted tuple can prevent selects from the entire table. Corruption in xmin, xmax and hint bits will cause a query to fail because the MVCC mechanism will be unable to determine visibility of these damaged tuples. Without data block checksums, we cannot easily zero out such damaged pages, since their header already passed the “sanity” test. We would have to do salvaging row-by-row using a PL/pgSQL script. But if a table is huge and the count of damaged tuples is small, this will be highly impractical.
In such a case, we should think about using the pg_surgery extension to freeze or remove corrupted tuples. But first, the correct identification of damaged tuples is critical, and second, the extension exists since PostgreSQL 14, it is not available in older versions. Its functions require ctid, but we must construct a proper value based on page number and ordinal number of the tuple in the page, we cannot use a damaged ctid from tuple header as shown above.
Freeze vs kill
Frozen tuples are visible to all transactions and stop blocking reads. But they still contain corrupted data: queries will return garbage. Therefore, just freezing corrupted tuples will most likely not help us, and we must kill damaged tuples. But freezing them first might be helpful for making sure we are targeting the proper tuples. Freezing simply means that function heap_force_freeze (with the proper ctid) will replace t_xmin with value 2 (frozen tuple), t_xmax with 0 and will repair t_ctid.
But all other values will stay as they are, i.e. still damaged. Using the pageinspect extension as shown above will confirm we work with a proper tuple. After this check, we can kill damaged tuples using the heap_force_kill function with the same parameters. This function will rewrite the pointer in the Item ID array for this specific tuple and mark it as dead.
Warning — functions in pg_surgery are considered unsafe by definition, so use them with caution. You can call them from SQL like any other function, but they are not MVCC-transactional operations. Their actions are irreversible – ROLLBACK cannot “undo” a freeze or kill, because these functions directly modify a heap page in shared buffers and WAL-log the change. Therefore, we should first test them on a copy of that specific table (if possible) or on some test table. Killing the tuple can also cause inconsistency in indexes, because the tuple does not exist anymore, but it could be referenced in some index. They write changes into the WAL log; therefore, the change will be replicated to standbys.
Summary
 PostgreSQL 17 introduced streaming I/O – grouping multiple page reads into a single system call and using smarter posix_fadvise() hints. That alone gave up to ~30% faster sequential scans in some workloads, but it was still strictly synchronous: each backend process would issue a read and then sit there waiting for the kernel to return data before proceeding. Before PG17, PostgreSQL typically read one 8kB page at a time.
- Heap sequential scans, like plain SELECT and COPY operations that stream lots of data
- VACUUM on big tables and indexes
- ANALYZE sampling
- Bitmap heap scans
Autovacuum benefits from this change too, since its workers share the same VACUUM/ANALYZE code paths. Other operations still remain synchronous for now:
- B‑tree index scans / index‑only scans
- Recovery & replication
- All write operations INSERT, UPDATE, DELETE, WAL writes
- Small OLTP lookups that touch a single heap page
Future work is expected to widen coverage, especially index‑only scans and some write‑path optimizations.
Significant improvements for cloud volumes
Community benchmarks show that PostgreSQL 18 AIO significantly improves cold cache data reads in cloud setups with network‑attached storage where latency is high. AWS documentation states that average latency of Block Express volumes is “under 500 microseconds for 16 KiB I/O size”, when latency of General Purpose volumes can exceed 800 microseconds. Some articles suggest that under high load each physical block read from disk can cost around 1ms, while page processing in PostgreSQL is much cheaper. By combining many pages into one read, all these pages together now cost around 1ms. And by performing multiple reading requests at the same time in parallel, we effectively pay that 1ms latency just once per the whole batch.
Asynchronous I/O methods
The new subsystem can run in one of three modes, configured via io_method parameter with possible values “worker” (default), “io_uring“, and “sync“. We will cover how each works and then show how to monitor asynchronous I/O in our environment.
io_method = sync
This mode effectively turns AIO off. Reads are executed through the same AIO API but synchronously, using regular preadv or pwritev methods on the backend process that issued the I/O. This method does not use any extra shared memory and is intended mainly for regression testing or if we suspect AIO is misbehaving. It is also used internally as fall back to the synchronous I/O for operations which cannot use asynchronous I/O. PostgreSQL core functions issue an error, if some extension would try to force asynchronous I/O through AIO API when global io_method is set to “sync”. Available benchmarks show that this PostgreSQL 18 mode performs similarly to PostgreSQL 17’s streaming I/O.
io_method = io_uring (Linux only)
SELECT pg_config FROM pg_config() where pg_config::text ilike ’%liburing%’;
- Backends write requests via API into a submission ring in shared memory
- The kernel performs I/O asynchronously and writes results into a completion ring
- Completion ring content is consumed by the backend with fewer context switches
Execution still happens in the same process, like with the “sync” method, but it uses kernel worker threads for parallel processing. This typically shines on very fast NVMe SSDs.
However, io_uring Linux feature also has had a rough security history. It bypasses traditional syscall audit paths and therefore has been involved in a large share of Linux kernel exploits. Google reported that 60% of Linux kernel vulnerabilities in 2022 involved io_uring and some security tools were unable to uncover these types of attacks. Therefore some container environments disable io_uring entirely.
io_method = worker
This is the cross‑platform, “safe” implementation and the default in PostgreSQL 18. Mechanism is very similar to existing parallel query processing. The main difference is that background I/O workers are long‑lived independent processes created at server start, not short‑lived processes spawned per query.
- At server start, the postmaster creates a pool of I/O worker processes. Number is controlled by io_workers parameter with a default of 3. However, benchmarks suggest this number should be higher on many‑core machines, typically between ¼ and ½ of available CPU threads. Best value depends on workload and storage latency.
- Backends submit read requests into a shared memory submission queue. This submission queue is generally a ring buffer that multiple backends can write into concurrently. It contains only metadata about the request – handle indices, not full request record. There is only one submission queue for the entire cluster, not per database or per backend. The actual details of the request are stored in separate memory structure.
- Request is checked if it must be executed synchronously or can be handled asynchronously. Synchronous execution can also be chosen if the submission queue is full. This avoids problems with shared memory usage under extreme load. In case of synchronous execution, code uses path for “sync” method described above.
- Request submission in shared memory wakes up one I/O worker, which pops request and executes traditional blocking read() / pread() calls. If queue is still not empty, woken worker can wake up 2 additional workers to process it in parallel. Note in code mentions that this can be in the future extended to configurable N workers. This limit helps to avoid so called “thundering herd problem”, when single submitter would wake up too many workers causing havoc and locks for other backends.
- One limitation for asynchronous I/O is the fact, that workers cannot simply reuse file descriptors opened by backends, they must reopen files in their own context. If this is not possible for some types of operations, synchronous I/O path is used for that specific request.
- When workers finish a request without an error, they write data blocks into share buffers, put result into a completion queue and signal the backend.
- From the perspective of the backend, I/O becomes “asynchronous”, because the “waiting” happens in worker processes, not in the query process itself.
- Works on all supported OSes
- Simple error handling: if a worker crashes, requests are marked as failed, worker exits and a new worker is spawned by postmaster
- Avoids the security concerns around Linux io_uring interface
- The downside is extra context switches and possible shared‑memory queue contention, but for many workloads the ability to overlap reads easily pays for that
- This method improves performance even in the case when all blocks are just copied from local Linux memory cache, because it is now done in parallel
Tuning the New I/O Parameters
PostgreSQL 18 adds or updates several parameters related to disk I/O. We already covered io_method and io_workers; let’s look at the others. Another new parameters are io_combine_limit and io_max_combine_limit. They control how many data pages PostgreSQL groups into a single AIO request. Larger requests typically yield better throughput, but can also increase latency and memory usage. Values without units are interpreted in 8kB data blocks. With units (kB, MB), they directly represent size – however, should be multiples of 8kB.
Parameter io_max_combine_limit is a hard server‑start cap, io_combine_limit is the user‑tunable value that can be changed at runtime but cannot exceed the max. Default values of both is 128kB (16 data pages). But documentation recommends setting up to 1MB on Unix (128 data pages) and 128kB on Windows (16 data pages – due to limitations in internal Widows buffers). We can experiment with higher values, but based on HW and OS limits AIO benefits plateau after some chunk size; pushing this too high doesn’t help and can even increase latency.
PostgreSQL 18 introduces also io_max_concurrency setting, which controls max number of IOs that one process can execute simultaneously. Default setting -1 means value will be selected automatically based on other settings, but it cannot exceed 64.
Other related parameter is effective_io_concurrency – number of concurrent I/O operations that can be executed simultaneously on storage. Range of values is from 1 to 1000, value 0 disables asynchronous I/O requests. Default value is now 16, some community articles suggest to go up to 200 on modern SSDs. Best setting depends on specific hardware and OS, however, some articles also warn that too high value may significantly increase I/O latency for all queries.
How to Monitor Asynchronous I/O
pg_stat_activity
SELECT pid, backend_start, wait_event_type, wait_event, backend_type
FROM pg_stat_activity
WHERE backend_type = 'io worker';


  pid |        backend_start          | wait_event_type |  wait_event  | backend_type
------+-------------------------------+-----------------+--------------+--------------
   34 | 2025-12-09 11:44:23.852461+00 | Activity        | IoWorkerMain | io worker
   35 | 2025-12-09 11:44:23.852832+00 | Activity        | IoWorkerMain | io worker
   36 | 2025-12-09 11:44:23.853119+00 | IO              | DataFileRead | io worker
   37 | 2025-12-09 11:44:23.8534+00   | IO              | DataFileRead | io worker
SELECT a.pid, a.usename, a.application_name, a.backend_type, a.state, a.query,
ai.operation, ai.state AS aio_state, ai.length AS aio_bytes, ai.target_desc
FROM pg_aios ai
JOIN pg_stat_activity a ON a.pid = ai.pid
ORDER BY a.backend_type, a.pid, ai.io_id;


-[ RECORD 1 ]----+------------------------------------------------------------------------
             pid | 58
         usename | postgres
application_name | psql
    backend_type | client backend
           state | active
           query | explain analyze SELECT ........
       operation | readv
       aio_state | SUBMITTED
       aio_bytes | 704512
     target_desc | blocks 539820..539905 in file "pg_tblspc/16647/PG_18_202506291/5/16716"
-[ RECORD 2 ]----+------------------------------------------------------------------------
             pid | 159
         usename | postgres
application_name | psql
    backend_type | parallel worker
           state | active
           query | explain analyze SELECT ........
       operation | readv
       aio_state | SUBMITTED
       aio_bytes | 704512
     target_desc | blocks 536326..536411 in file "pg_tblspc/16647/PG_18_202506291/5/16716"
pg_aios: Current AIO handles
- pid: backend issuing the I/O
- io_id, io_generation: identify a handle across reuse
- state: HANDED_OUT, DEFINED, STAGED, SUBMITTED, COMPLETED_IO, COMPLETED_SHARED, COMPLETED_LOCAL
- operation: invalid, readv (vectored read) or writev (vectored write)
- off, length: offset and size of I/O operation
- target, target_desc: what we’re reading/writing (typically relations)
- result: UNKNOWN, OK, PARTIAL, WARNING, ERROR
-- Summary of current AIO handles by state and result
SELECT state, result, count(*) AS cnt, pg_size_pretty(sum(length)) AS total_size
FROM pg_aios GROUP BY state, result ORDER BY state, result;

       state      |  result | cnt | total_size
------------------+---------+-----+------------
 COMPLETED_SHARED | OK      |   1 | 688 kB
 SUBMITTED        | UNKNOWN |   6 | 728 kB

-- In-flight async I/O handles
SELECT COUNT(*) AS aio_handles, SUM(length) AS aio_bytes FROM pg_aios;

 aio_handles | aio_bytes
-------------+-----------
           7 |     57344

-- Sessions currently waiting on I/O
SELECT COUNT(*) AS sessions_waiting_on_io FROM pg_stat_activity WHERE wait_event_type = 'IO';

 sessions_waiting_on_io
------------------------
9SELECT pid, state, operation, pg_size_pretty(length) AS io_size, target_desc, result FROM pg_aios ORDER BY pid, io_id; pid | state | operation | io_size | target_desc | result -----+-----------+-----------+------------+-------------------------------------------------------------------------+--------- 51 | SUBMITTED | readv | 688 kB | blocks 670470..670555 in file "pg_tblspc/16647/PG_18_202506291/5/16716" | UNKNOWN 63 | SUBMITTED | readv | 8192 bytes | block 1347556 in file "pg_tblspc/16647/PG_18_202506291/5/16719" | UNKNOWN 65 | SUBMITTED | readv | 688 kB | blocks 671236..671321 in file "pg_tblspc/16647/PG_18_202506291/5/16716" | UNKNOWN 66 | SUBMITTED | readv | 8192 bytes | block 1344674 in file "pg_tblspc/16647/PG_18_202506291/5/16719" | UNKNOWN 67 | SUBMITTED | readv | 8192 bytes | block 1337819 in file "pg_tblspc/16647/PG_18_202506291/5/16719" | UNKNOWN 68 | SUBMITTED | readv | 688 kB | blocks 672002..672087 in file "pg_tblspc/16647/PG_18_202506291/5/16716" | UNKNOWN 69 | SUBMITTED | readv | 688 kB | blocks 673964..674049 in file "pg_tblspc/16647/PG_18_202506291/5/16716" | UNKNOWN
pg_stat_io: Cumulative I/O stats
SELECT backend_type, context, sum(reads) AS reads,
pg_size_pretty(sum(read_bytes)) AS read_bytes,
round(sum(read_time)::numeric, 2) AS read_ms, sum(writes) AS writes,
pg_size_pretty(sum(write_bytes)) AS write_bytes,
round(sum(write_time)::numeric, 2) AS write_ms, sum(extends) AS extends,
pg_size_pretty(sum(extend_bytes)) AS extend_bytes
FROM pg_stat_io
WHERE object = 'relation' AND backend_type IN ('client backend')
GROUP BY backend_type, context
ORDER BY backend_type, context;

   backend_type |  context  |  reads  | read_bytes |  read_ms  | writes | write_bytes | write_ms | extends | extend_bytes
----------------+-----------+---------+------------+-----------+--------+-------------+----------+---------+--------------
 client backend | bulkread  |   13833 | 9062 MB    | 124773.28 |      0 | 0 bytes     |     0.00 |         |
 client backend | bulkwrite |       0 | 0 bytes    |      0.00 |      0 | 0 bytes     |     0.00 |       0 | 0 bytes
 client backend | init      |       0 | 0 bytes    |      0.00 |      0 | 0 bytes     |     0.00 |       0 | 0 bytes
 client backend | normal    | 2265214 | 17 GB      | 553940.57 |      0 | 0 bytes     |     0.00 |       0 | 0 bytes
 client backend | vacuum    |       0 | 0 bytes    |      0.00 |      0 | 0 bytes     |     0.00 |       0 | 0 bytes


-- Top tables by heap blocks read and cache hit ratio
SELECT relid::regclass AS table_name, heap_blks_read, heap_blks_hit,
ROUND( CASE WHEN heap_blks_read + heap_blks_hit = 0 THEN 0
ELSE heap_blks_hit::numeric / (heap_blks_read + heap_blks_hit) * 100 END, 2) AS cache_hit_pct
FROM pg_statio_user_tables
ORDER BY heap_blks_read DESC LIMIT 20;

      table_name      | heap_blks_read | heap_blks_hit | cache_hit_pct
----------------------+----------------+---------------+---------------
 table1               |       18551282 |       3676632 |         16.54
 table2               |        1513673 |     102222970 |         98.54
 table3               |          19713 |       1034435 |         98.13
...


-- Top indexes by index blocks read and cache hit ratio
SELECT relid::regclass AS table_name, indexrelid::regclass AS index_name,
idx_blks_read, idx_blks_hit
FROM pg_statio_user_indexes
ORDER BY idx_blks_read DESC LIMIT 20;

 table_name |    index_name   | idx_blks_read | idx_blks_hit
------------+-----------------+---------------+--------------
 table1     | idx_table1_date |        209289 |          141
 table2     | table2_pkey     |         37221 |      1223747
 table3     | table3_pkey     |          9825 |      3143947
...SELECT pg_stat_reset_shared('io');Then run our workload and query pg_stat_io again to see how many bytes were read/written and how much time was spent waiting on I/O.
Conclusion
PostgreSQL is a registered trademark oftThe PostgreSQL Community Association of Canada.
In the past there have been many discussions about using UUID as a primary key in PostgreSQL. For some applications, even a BIGINT column does not have sufficient range: it is a signed 8‑byte integer with range −9,223,372,036,854,775,808 to +9,223,372,036,854,775,807. Although these values look big enough, if we think about web services that collect billions or more records daily, this number becomes less impressive. Simple integer values can also cause conflicts of values in distributed system, in Data Lakehouses when combining data from multiple source databases etc.
However, the main practical problem with UUIDv4 as a primary key in PostgreSQL was not lack of range, but the complete randomness of the values. This randomness causes frequent B‑tree page splits, a highly fragmented primary key index, and therefore a lot of random disk I/O. There have already been many articles and conference talks describing this problem. What many of these resources did not do, however, was dive deep into the on‑disk structures. That’s what I wanted to explore here.

What are UUIDs
UUID (Universally Unique Identifier) is a 16‑byte integer value (128 bits), which has 2^128 possible combinations (approximately 3.4 × 10^38). This range is so large that, for most applications, the probability of a duplicate UUID is practically zero. Wikipedia shows a calculation demonstrating that the probability to find a duplicate within 103 trillion version‑4 UUIDs is about one in a billion. Another often‑quoted rule of thumb is that to get a 50% chance of one collision, you’d have to generate roughly 1 billion UUIDs every second for about 86 years.
Values are usually represented as a 36‑character string with hexadecimal digits and hyphens, for example: f47ac10b-58cc-4372-a567-0e02b2c3d479. The canonical layout is 8‑4‑4‑4‑12 characters. The first character in the third block and the first character in the fourth block have special meaning: xxxxxxxx-xxxx-Vxxx-Wxxx-xxxxxxxxxxxx – V marks UUID version (4 for UUIDv4, 7 for UUIDv7, etc.), W encodes the variant in its upper 2 or 3 bits (the layout family of the UUID).
Until PostgreSQL 18, the common way to generate UUIDs in PostgreSQL was to use version‑4 (for example via gen_random_uuid() or uuid_generate_v4() from extensions). PostgreSQL 18 introduces native support for the new time‑ordered UUIDv7 via uuidv7() function, and also adds uuidv4() as a built‑in alias for older gen_random_uuid() function. UUID version 4 is generated completely randomly (except for the fixed version and variant bits), so there is no inherent sequence in the values. UUID version 7 generates values that are time‑ordered, because the first 48 bits contain a big‑endian Unix epoch timestamp with roughly millisecond granularity, followed by additional sub‑millisecond bits and randomness.

Test setup in PostgreSQL 18
I will show concrete results using a simple test setup – 2 different tables with column “id” containing generated UUID value (either v4 or v7), used as primary key, column “ord” with sequentially generated bigint, preserving the row creation order.
-- UUIDv4 (completely random keys)
CREATE TABLE uuidv4_demo (
    id uuid PRIMARY KEY DEFAULT uuidv4(), -- alias of gen_random_uuid()
    ord bigint GENERATED ALWAYS AS IDENTITY
);

-- UUIDv7 (time-ordered keys)
CREATE TABLE uuidv7_demo (
    id uuid PRIMARY KEY DEFAULT uuidv7(),
    ord bigint GENERATED ALWAYS AS IDENTITY
);

-- 1M rows with UUIDv4
INSERT INTO uuidv4_demo (id) SELECT uuidv4() FROM generate_series(1, 1000000);

-- 1M rows with UUIDv7
INSERT INTO uuidv7_demo (id) SELECT uuidv7() FROM generate_series(1, 1000000);

VACUUM ANALYZE uuidv4_demo;
VACUUM ANALYZE uuidv7_demo;
Query‑level performance: EXPLAIN ANALYZE
As the first step, let’s compare the costs of ordering by UUID for the two tables:
-- UUIDv4
EXPLAIN (ANALYZE, BUFFERS) SELECT * FROM uuidv4_demo ORDER BY id;

Index Scan using uuidv4_demo_pkey on uuidv4_demo (cost=0.42..60024.31 rows=1000000 width=24) (actual time=0.031..301.163 rows=1000000.00 loops=1)
  Index Searches: 1
  Buffers: shared hit=1004700 read=30
Planning Time: 0.109 ms
Execution Time: 318.005 ms

-- UUIDv7
EXPLAIN (ANALYZE, BUFFERS) SELECT * FROM uuidv7_demo ORDER BY id;

Index Scan using uuidv7_demo_pkey on uuidv7_demo (cost=0.42..36785.43 rows=1000000 width=24) (actual time=0.013..96.177 rows=1000000.00 loops=1)
  Index Searches: 1
  Buffers: shared hit=2821 read=7383
Planning Time: 0.040 ms
Execution Time: 113.305 ms
The exact buffer numbers depend on caching effects, but one thing is clear in this run: the index scan over UUIDv7 needs roughly 100 times less buffer hits and is around three times faster (113 ms vs 318 ms) for the same million‑row ORDER BY id. This is the first sign that UUIDv7 is a very viable solution for a primary key when we need to replace a BIGINT column with something that has a much larger space and uniqueness, while still behaving like a sequential key from the point of view of the index.
Speed of Inserts – simple benchmarking
Originally I wanted to make more sophisticated tests, but even very basic naive benchmark showed huge difference in speed of inserts. I compared time taken to insert 50 million rows into empty table, then again, into the table with 50 million existing rows.
INSERT INTO uuidv4_demo (id) SELECT uuidv4() FROM generate_series(1, 50000000);
INSERT INTO uuidv7_demo (id) SELECT uuidv7() FROM generate_series(1, 50000000);

-- UUID v4                                 -- UUID v7
                                Empty table
Insert time: 1239839.702 ms (20:39.840)    Insert time: 106343.314 ms (01:46.343)
Table size: 2489 MB                        Table size: 2489 MB
Index size: 1981 MB                        Index size: 1504 MB

                            Table with 50M rows
Insert time: 2776880.790 ms (46:16.881)    Insert time: 100354.087 ms (01:40.354)
Table size: 4978 MB                        Table size: 4978 MB
Index size: 3956 MB                        Index size: 3008 MB
As we can see, speed of inserts is radically different. Insertion of the first 50 million rows into empty table took only 1:46 minutes for UUIDv7, but already 20 minutes for UUIDv4. Second batch showed even 2 times bigger difference.
How values are distributed in the table
These results indicate huge differences in indexes. So let’s analyze it. First we will check how the values are distributed in the table, I use the following query for both tables (just switching the table name):
SELECT
    row_number() OVER () AS seq_in_uuid_order,
    id,
    ord,
    ctid
FROM uuidv4_demo
ORDER BY id
LIMIT 20;
Column seq_in_uuid_order is just the row number in UUID order, ord is the insertion order, ctid shows the physical location of each tuple in the heap: (block_number, offset_in_block).
UUIDv4: random UUID order ⇒ random heap access
How do the results look for UUIDv4?
 seq_in_uuid_order |                 id                   |   ord  |    ctid
-------------------+--------------------------------------+--------+------------
                 1 | 00000abf-cc8e-4cb2-a91a-701a3c96bd36 | 673969 | (4292,125)
                 2 | 00001827-16fe-4aee-9bce-d30ca49ceb1d | 477118 | (3038,152)
                 3 | 00001a84-6d30-492f-866d-72c3b4e1edff | 815025 | (5191,38)
                 4 | 00002759-21d1-4889-9874-4a0099c75286 | 879671 | (5602,157)
                 5 | 00002b44-b1b5-473f-b63f-7554fa88018d | 729197 | (4644,89)
                 6 | 00002ceb-5332-44f4-a83b-fb8e9ba73599 | 797950 | (5082,76)
                 7 | 000040e2-f6ac-4b5e-870a-63ab04a5fa39 | 160314 | (1021,17)
                 8 | 000053d7-8450-4255-b320-fee8d6246c5b | 369644 | (2354,66)
                 9 | 00009c78-6eac-4210-baa9-45b835749838 | 463430 | (2951,123)
                10 | 0000a118-f98e-4e4a-acb3-392006bcabb8 |  96325 | (613,84)
                11 | 0000be99-344b-4529-aa4c-579104439b38 | 454804 | (2896,132)
                12 | 00010300-fcc1-4ec4-ae16-110f93023068 |  52423 | (333,142)
                13 | 00010c33-a4c9-4612-ba9a-6c5612fe44e6 |  82935 | (528,39)
                14 | 00011fa2-32ce-4ee0-904a-13991d451934 | 988370 | (6295,55)
                15 | 00012920-38c7-4371-bd15-72e2996af84d | 960556 | (6118,30)
                16 | 00014240-7228-4998-87c1-e8b23b01194a |  66048 | (420,108)
                17 | 00014423-15fc-42ca-89bd-1d0acf3e5ad2 | 250698 | (1596,126)
                18 | 000160b9-a1d8-4ef0-8979-8640025c0406 | 106463 | (678,17)
                19 | 0001711a-9656-4628-9d0c-1fb40620ba41 | 920459 | (5862,125)
                20 | 000181d5-ee13-42c7-a9e7-0f2c52faeadb | 513817 | (3272,113)
Values are distributed completely randomly. Reading rows in UUID order practically does not make sense here and leads directly into random heap access for queries that use the primary key index.
UUIDv7: UUID order follows insertion order
On the other hand, UUIDv7 values are generated in a clear sequence:
 seq_in_uuid_order |                  id                  | ord | ctid
-------------------+--------------------------------------+-----+--------
                 1 | 019ad94d-0127-7aba-b9f6-18620afdea4a |   1 | (0,1)
                 2 | 019ad94d-0131-72b9-823e-89e41d1fad73 |   2 | (0,2)
                 3 | 019ad94d-0131-7384-b03d-8820be60f88e |   3 | (0,3)
                 4 | 019ad94d-0131-738b-b3c0-3f91a0b223a8 |   4 | (0,4)
                 5 | 019ad94d-0131-7391-ab84-a719ca98accf |   5 | (0,5)
                 6 | 019ad94d-0131-7396-b41d-7f9f27a179c4 |   6 | (0,6)
                 7 | 019ad94d-0131-739b-bdb3-4659aeaafbdd |   7 | (0,7)
                 8 | 019ad94d-0131-73a0-b271-7dba06512231 |   8 | (0,8)
                 9 | 019ad94d-0131-73a5-8911-5ec5d446c8a9 |   9 | (0,9)
                10 | 019ad94d-0131-73aa-a4a3-0e5c14f09374 |  10 | (0,10)
                11 | 019ad94d-0131-73af-ac4b-3710e221390e |  11 | (0,11)
                12 | 019ad94d-0131-73b4-85d6-ed575d11e9cf |  12 | (0,12)
                13 | 019ad94d-0131-73b9-b802-d5695f5bf781 |  13 | (0,13)
                14 | 019ad94d-0131-73be-bcb0-b0775dab6dd4 |  14 | (0,14)
                15 | 019ad94d-0131-73c3-9ec8-c7400b5c8983 |  15 | (0,15)
                16 | 019ad94d-0131-73c8-b067-435258087b3a |  16 | (0,16)
                17 | 019ad94d-0131-73cd-a03f-a28092604fb1 |  17 | (0,17)
                18 | 019ad94d-0131-73d3-b4d5-02516d5667b5 |  18 | (0,18)
                19 | 019ad94d-0131-73d8-9c41-86fa79f74673 |  19 | (0,19)
                20 | 019ad94d-0131-73dd-b9f1-dcd07598c35d |  20 | (0,20)
Here, seq_in_uuid_order, ord, and ctid all follow each other nicely – ord increases by 1 for each row, ctid moves sequentially through the first heap page, and UUIDs themselves are monotonic because of the timestamp prefix. For index scans on the primary key, this means Postgres can walk the heap in a much more sequential way than with UUIDv4.
How sequential are these values statistically?
After VACUUM ANALYZE, I ask the planner what it thinks about the correlation between id and the physical order:
SELECT
    tablename,
    attname,
    correlation
FROM pg_stats
WHERE tablename IN ('uuidv4_demo', 'uuidv7_demo')
AND attname = 'id'
ORDER BY tablename, attname;
Result:
   tablename | attname | correlation
-------------+---------+---------------
 uuidv4_demo |      id | -0.0024808696
 uuidv7_demo |      id |             1
The statistics confirm what we just saw:
- For uuidv4_demo.id, the correlation is essentially 0 ⇒ values are random with respect to heap order.
- For uuidv7_demo.id, the correlation is 1 ⇒ perfect alignment between UUID order and physical row order in this test run.
That high correlation is exactly why UUIDv7 is so attractive as a primary key for B‑tree indexes.
Primary key indexes: size, leaf pages, density, fragmentation
Next I look at the primary key indexes – their size, number of leaf pages, density, and fragmentation – using pgstatindex:
SELECT 'uuidv4_demo_pkey' AS index_name, (pgstatindex('uuidv4_demo_pkey')).*;

        index_name | uuidv4_demo_pkey
           version | 4
        tree_level | 2
        index_size | 40026112
     root_block_no | 295
    internal_pages | 24
        leaf_pages | 4861
       empty_pages | 0
     deleted_pages | 0
  avg_leaf_density | 71
leaf_fragmentation | 49.99

SELECT 'uuidv7_demo_pkey' AS index_name, (pgstatindex('uuidv7_demo_pkey')).*;

        index_name | uuidv7_demo_pkey
           version | 4
        tree_level | 2
        index_size | 31563776
     root_block_no | 295
    internal_pages | 20
        leaf_pages | 3832
       empty_pages | 0
     deleted_pages | 0
  avg_leaf_density | 89.98      -- i.e. standard 90% fillfactor
leaf_fragmentation | 0
We can immediately see that the primary key index on UUIDv4 is about 26–27% bigger:
- index_size is ~40 MB vs ~31.6 MB
- leaf_pages are 4861 vs 3832 (again about 26–27% more)
- leaf pages in the v4 index have lower average density (71 vs ~90)
- leaf_fragmentation for v4 is about 50%, while for v7 it is 0
So UUIDv4 forces the B‑tree to allocate more pages and keep them less full, and it fragments the leaf level much more.
Deeper index analysis with bt_multi_page_stats
To go deeper, I examined the B‑tree indexes page by page and built some statistics. I used the following query for both indexes (just changing the index name in the CTE). The query calculates the minimum, maximum, and average number of tuples per index leaf page, and also checks how sequentially leaf pages are stored in the index file:
WITH leaf AS (
    SELECT *
    FROM bt_multi_page_stats('uuidv4_demo_pkey', 1, -1) -- from block 1 to end
    WHERE type = 'l'
)
SELECT
    count(*) AS leaf_pages,
    min(blkno) AS first_leaf_blk,
    max(blkno) AS last_leaf_blk,
    max(blkno) - min(blkno) + 1 AS leaf_span,
    round( count(*)::numeric / (max(blkno) - min(blkno) + 1), 3) AS leaf_density_by_span,
    min(live_items) AS min_tuples_per_page,
    max(live_items) AS max_tuples_per_page,
    avg(live_items)::numeric(10,2) AS avg_tuples_per_page,
    sum(CASE WHEN btpo_next = blkno + 1 THEN 1 ELSE 0 END) AS contiguous_links,
    sum(CASE WHEN btpo_next <> 0 AND btpo_next <> blkno + 1 THEN 1 ELSE 0 END) AS non_contiguous_links
FROM leaf;
Results for UUIDv4:
-- uuidv4_demo_pkey
          leaf_pages | 4861
      first_leaf_blk | 1
       last_leaf_blk | 4885
           leaf_span | 4885
leaf_density_by_span | 0.995
 min_tuples_per_page | 146
 max_tuples_per_page | 291
 avg_tuples_per_page | 206.72
    contiguous_links | 0
non_contiguous_links | 4860
Results for UUIDv7:
-- uuidv7_demo_pkey
          leaf_pages | 3832
      first_leaf_blk | 1
       last_leaf_blk | 3852
           leaf_span | 3852
leaf_density_by_span | 0.995
 min_tuples_per_page | 109
 max_tuples_per_page | 262
 avg_tuples_per_page | 261.96
    contiguous_links | 3812
non_contiguous_links | 19
As we can see- the UUIDv4 index has more leaf pages, spread over a larger span of blocks, and although it has higher minimum and maximum tuples per page, its average number of tuples per leaf page (206.72) is significantly lower than for UUIDv7 (261.96).
But these numbers can obscure the whole pictures. So, let’s look at histograms visualizing count of tuples in leaf pages. For this I will use following query with buckets between 100 and 300 and will list only non empty results:
WITH leaf AS (
    SELECT live_items
    FROM bt_multi_page_stats('uuidv4_demo_pkey', 1, -1)
    WHERE type = 'l'
),
buckets AS (
    -- bucket lower bounds: 100, 110, ..., 290
    SELECT generate_series(100, 290, 10) AS bucket_min
)
SELECT
    b.bucket_min AS bucket_from,
    b.bucket_min + 9 AS bucket_to,
    COUNT(l.live_items) AS page_count
FROM buckets b
LEFT JOIN leaf l
    ON l.live_items BETWEEN b.bucket_min AND b.bucket_min + 9
GROUP BY b.bucket_min HAVING count(l.live_items) > 0
ORDER BY b.bucket_min;
Result for UUIDv4:
 bucket_from | bucket_to | page_count
-------------+-----------+------------
         140 |       149 |        159
         150 |       159 |        435
         160 |       169 |        388
         170 |       179 |        390
         180 |       189 |        427
         190 |       199 |        466
         200 |       209 |        430
         210 |       219 |        387
         220 |       229 |        416
         230 |       239 |        293
         240 |       249 |        296
         250 |       259 |        228
         260 |       269 |        214
         270 |       279 |        171
         280 |       289 |        140
         290 |       299 |         21
Result for UUIDv7:
 bucket_from | bucket_to | page_count
-------------+-----------+------------
         100 |       109 |          1
         260 |       269 |       3831
There results nicely demonstrate huge fragmentation of UUIDv4 index and stable compact structure of UUIDv7 index. The lowest buckets in UUIDv4 histogram show cases of half empty leaf index pages, on the other hand pages with more than 270 tuples exceed 90% fillfactor, because PostgreSQL uses remaining free space to avoid split. In the UUIDv7 index all leaf pages except for one (the very last one in the tree) are filled up to 90% standard fillfactor.
Another important result is in the last two columns of index statistics:
- For UUIDv4: contiguous_links = 0, non_contiguous_links = 4860
- For UUIDv7: contiguous_links = 3812, non_contiguous_links = 19
btpo_next = blkno + 1 means the next leaf page in the logical B‑tree order is also the next physical block. With UUIDv4, that never happens in this test – the leaf pages are completely fragmented, randomly distributed over the index structure. With UUIDv7, almost all leaf pages are contiguous, i.e. nicely follow each other.
Also, when we examine the actual content of leaf pages, we can immediately see the randomness of UUIDv4 versus the sequential behavior of UUIDv7: UUIDv4 leaf pages point to heap tuples scattered all over the table, while UUIDv7 leaf pages tend to point into tight ranges of heap pages. The result is the same pattern we saw earlier when looking at ctid directly from the table, so I won’t repeat the raw dumps here.
A small gotcha: embedded timestamp in UUIDv7
There is one small gotcha with UUIDv7 values: they expose a timestamp of creation. PostgreSQL 18 exposes this explicitly via uuid_extract_timestamp():
SELECT
    id,
    uuid_extract_timestamp(id) AS created_at_from_uuid
FROM uuidv7_demo
ORDER BY ord
LIMIT 5;
Sample results:
                   id                 |       created_at_from_uuid
--------------------------------------+----------------------------
 019ad94d-0127-7aba-b9f6-18620afdea4a | 2025-12-01 09:44:53.799+00
 019ad94d-0131-72b9-823e-89e41d1fad73 | 2025-12-01 09:44:53.809+00
 019ad94d-0131-7384-b03d-8820be60f88e | 2025-12-01 09:44:53.809+00
 019ad94d-0131-738b-b3c0-3f91a0b223a8 | 2025-12-01 09:44:53.809+00
 019ad94d-0131-7391-ab84-a719ca98accf | 2025-12-01 09:44:53.809+00
If we look at the whole sequence of values, we can analyze the time deltas between record creations directly from the UUIDs, without any separate timestamp column. For some applications this could be considered a potential information leak (for example, revealing approximate creation times or request rates), while many others will most likely not care.
Summary
- UUIDs provide an enormous identifier space (128 bits, ~3.4 × 10^38 values) where the probability of collision is negligible for real‑world workloads.
- Traditional UUIDv4 keys are completely random. When used as primary keys in PostgreSQL, they tend to:
- fragment B‑tree indexes
- lower leaf page density
- cause highly random heap access patterns and more random I/O
- UUIDv7, introduced natively in PostgreSQL 18 as uuidv7(), keeps the 128‑bit space but reorders the bits so that:
- the most significant bits contain a Unix timestamp with millisecond precision (plus sub‑millisecond fraction)
- the remaining bits stay random
- In practical tests with 1M rows per table:
- The UUIDv7 primary key index was about 26–27% smaller, with fewer leaf pages and much higher average leaf density
- Leaf pages in the UUIDv7 index were overwhelmingly physically contiguous, whereas the UUIDv4 leaf pages were completely fragmented
- An ORDER BY id query over UUIDv7 was roughly three times faster in my run than the same query over UUIDv4, thanks to better index locality and more sequential heap access
The trade‑off is that UUIDv7 embeds a timestamp, which might expose approximate creation times, but for most use cases this is acceptable or even useful. So, UUIDv7 significantly improves the performance and physical layout of UUID primary keys in PostgreSQL, not by abandoning randomness, but by adding a time‑ordered prefix. In PostgreSQL 18, that gives us the best of both worlds: the huge identifier space and distributed generation benefits of UUIDs, with index behavior much closer to a classic sequential BIGINT primary key.
PostgreSQL is an open-source database provided by the PostgreSQL developers. The PostgreSQL Elephant Logo (“Slonik”), Postgres and PostgreSQL are registered trademarks by the PostgreSQL Community Association.
We at credativ provide comprehensive support and consulting services running PostgreSQL and other open-source systems.
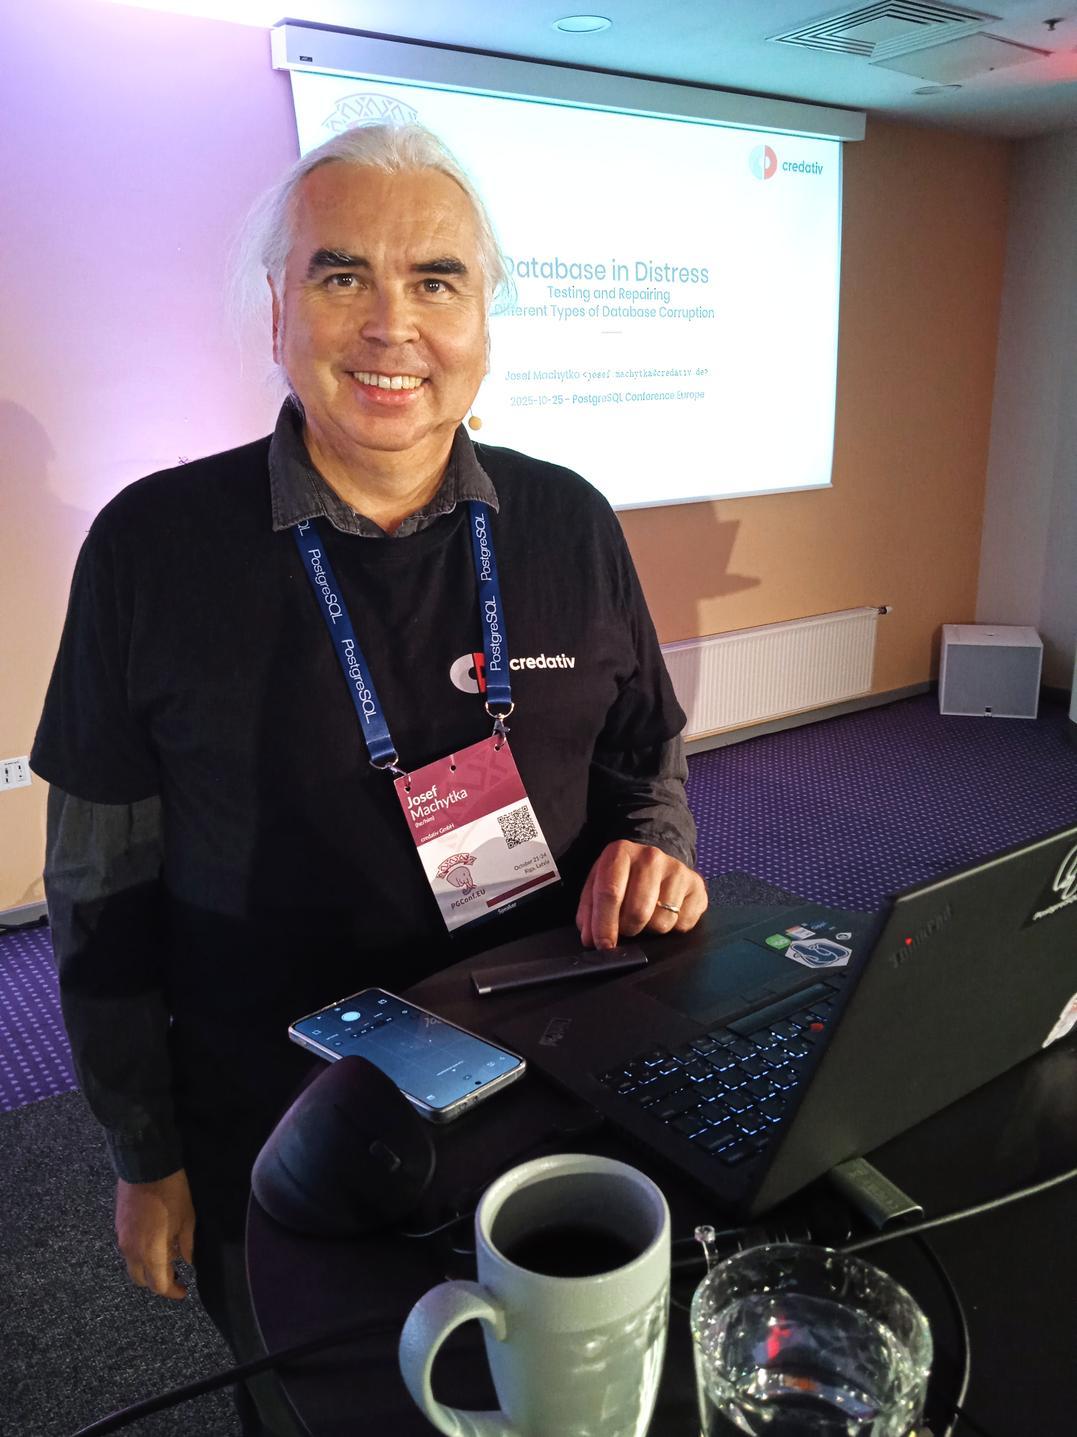
The European PostgreSQL Conference (PGConf.EU) is one of the largest PostgreSQL events worldwide. In this year it was held 21–24 October in Riga, Latvia. Our company, credativ GmbH, was a bronze sponsor of the conference, and I had the privilege to represent credativ with my talk “Database in Distress: Testing and Repairing Different Types of Database Corruption.” In addition, I volunteered as a session host on Thursday and Friday. The conference itself covered a wide range of PostgreSQL topics – from cloud-native deployments to AI integration, from large-scale migrations to resiliency. Below are highlights from sessions I attended, organised by day.
My talk about database corruption
I presenting my talk on Friday afternoon. In it I dove into real-world cases of PostgreSQL database corruption I encountered over the past two years. To investigate these issues, I built a Python tool that deliberately corrupts database pages and then examined the results using PostgreSQL’s pageinspect extension. During the talk I demonstrated various corruption scenarios and the errors they produce, explaining how to diagnose each case. A key point was that PostgreSQL 18 now enables data checksums by default at initdb. Checksums allow damaged pages to be detected and safely “zeroed out” (skipping corrupted data) during recovery. Without checksums, only pages with clearly corrupted headers can be automatically removed using the zero_damaged_pages = on setting. Other types of corruption require careful manual salvage. I concluded by suggesting improvements (in code or settings) to make recovery easier on clusters without checksums.

Tuesday: Kubernetes and AI Summits
Tuesday began with two half-day Summits. The PostgreSQL on Kubernetes Summit explored running Postgres in cloud-native environments. Speakers compared Kubernetes operators (CloudNativePG, Crunchy, Zalando, etc.), backup/recovery in Kubernetes, scaling strategies, monitoring, and zero-downtime upgrades. They discussed operator architectures and multi-tenant DBaaS use cases. Attendees gained practical insight into trade-offs of different operators and how to run Kubernetes-based Postgres for high availability.
In the PostgreSQL & AI Summit, experts examined Postgres’s role in AI applications. Topics included vector search (e.g. pgvector), hybrid search, using Postgres as context storage for AI agents, conversational query interfaces, and even tuning Postgres with machine learning. Presenters shared best practices and integration strategies for building AI-driven solutions with Postgres. In short, the summit explored how PostgreSQL can serve AI workloads (and vice versa) and what new features or extensions are emerging for AI use cases.
Wednesday: Migrations, Modelling, and Performance
Joaquim Oliveira (European Space Agency) discussed moving astronomy datasets (from ESA’s Gaia and Euclid missions) off Greenplum. The team considered both scaling out with Citus and moving to EDB’s new Greenplum-based cloud warehouse. He covered the practical pros and cons of each path and the operational changes required to re-architect such exascale workloads. The key lesson was planning architecture, tooling, and admin shifts needed before undertaking a petabyte-scale migration.
Boriss Mejias (EDB) emphasised that data modelling is fundamental to software projects. Using a chess-tournament application as an example, he showed how to let PostgreSQL enforce data integrity. By carefully choosing data types and constraints, developers can embed much of the business logic directly in the schema. The talk demonstrated “letting PostgreSQL guarantee data integrity” and building application logic at the database layer.
Roberto Mello (Snowflake) reviewed the many optimizer and execution improvements in Postgres 18. For example, the planner now automatically eliminates unnecessary self-joins, converts IN (VALUES…) clauses into more efficient forms, and transforms OR clauses into arrays for faster index scans. It also speeds up set operations (INTERSECT, EXCEPT), window aggregates, and optimises SELECT DISTINCT and GROUP BY by reordering keys and ignoring redundant columns. Roberto compared query benchmarks across Postgres 16, 17, and 18 to highlight these gains.
Nelson Calero (Pythian) shared a “practical guide” for migrating 100+ PostgreSQL databases (from gigabytes to multi-terabytes) to the cloud. His team moved hundreds of on-prem VM databases to Google Cloud SQL. He discussed planning, downtime minimisation, instance sizing, tools, and post-migration tuning. In particular, he noted challenges like handling old version upgrades, inheritance schemas, PostGIS data, and service-account changes. Calero’s advice included choosing the right cloud instance types, optimising bulk data loads, and validating performance after migration.
Jan Wieremjewicz (Percona) recounted implementing Transparent Data Encryption (TDE) for Postgres via the pg_tde extension. He took the audience through the entire journey – from the initial idea, through patch proposals, to community feedback and design trade-offs. He explained why existing PostgreSQL hooks weren’t enough, what friction was encountered, and how customer feedback shaped the final design. This talk served as a “diary” of what it takes to deliver a core encryption feature through the PostgreSQL development process.
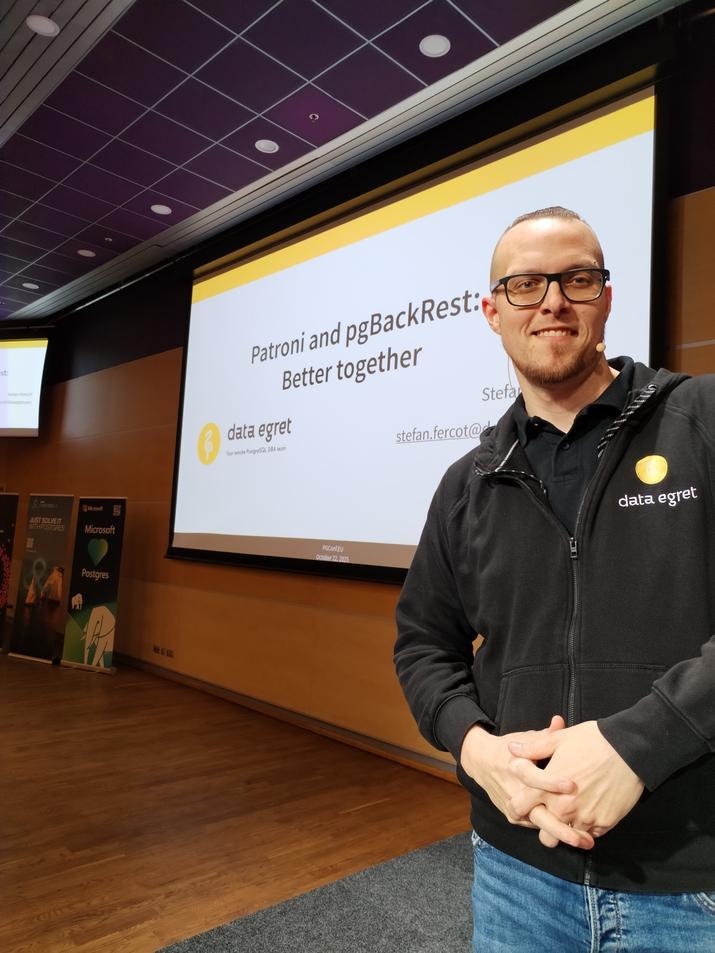
Stefan Fercot (Data Egret) demonstrated how to use Patroni (for high availability) together with pgBackRest (for backups). He walked through YAML configuration examples showing how to integrate pgBackRest into a Patroni-managed cluster. Stefan showed how to rebuild standby replicas from pgBackRest backups and perform point-in-time recovery (PITR) under Patroni’s control. The talk highlighted real-world operational wisdom: combining these tools provides automated, repeatable disaster recovery for Postgres clusters.
Thursday: Cloud, EXPLAIN, and Resiliency
Maximilian Stefanac and Philipp Thun (SAP SE) explained how SAP uses PostgreSQL within Cloud Foundry (SAP’s open-source PaaS). They discussed optimisations and scale challenges of running Postgres for SAP’s Business Technology Platform. Over the years, SAP’s Cloud Foundry team has deployed Postgres on AWS, Azure, Google Cloud, and Alibaba Cloud. Each provider’s offerings differ, so unifying automation and monitoring across clouds is a major challenge. The talk highlighted how SAP contributes Postgres performance improvements back to the community and what it takes to operate large-scale, cloud-neutral Postgres clusters.
In “EXPLAIN: Make It Make Sense,” Aivars Kalvāns (Ebury) helped developers interpret query plans. He emphasized that after identifying a slow query, you must understand why the planner chose a given plan and whether it is optimal. Aivars walked through EXPLAIN output and shared rules of thumb for spotting inefficiencies – for example, detecting missing indexes or costly operators. He illustrated common query anti-patterns he has seen in practice and showed how to rewrite them in a more database-friendly way. The session gave practical tips for decoding EXPLAIN and tuning queries.
Chris Ellis (Nexteam) highlighted built-in Postgres capabilities that simplify application development. Drawing on real-world use cases – such as event scheduling, task queues, search, geolocation, and handling heterogeneous data – he showed how features like range types, full-text search, and JSONB can reduce application complexity. For each use case, Chris demonstrated which Postgres feature or data type could solve the problem. This “tips & tricks” tour reinforced that leveraging Postgres’s rich feature set often means writing less custom code.
Andreas Geppert (Zürcher Kantonalbank) described a cross-cloud replication setup for disaster resilience. Faced with a requirement that at most 15 minutes of data could be lost if any one cloud provider failed, they could not use physical replication (since their cloud providers don’t support it). Instead, they built a multi-cloud solution using logical replication. The talk covered how they keep logical replicas up-to-date even as schemas change (noting that logical replication doesn’t automatically copy DDL). In short, logical replication enabled resilient, low-RPO operation across providers despite schema evolution.
Derk van Veen (Adyen) tackled the deeper rationale behind table partitioning. He emphasised the importance of finding the right partition key – the “leading figure” in your data – and then aligning partitions across all related tables. When partitions share a common key and aligned boundaries, you unlock multiple benefits: decent performance, simplified maintenance, built-in support for PII compliance, easy data cleanup, and even transparent data tiering. Derk warned that poorly planned partitions can hurt performance terribly. In his case, switching to properly aligned partitions (and enabling enable_partitionwise_join/_aggregate) yielded a 70× speedup on 100+ TB financial tables. All strategies he presented have been battle-tested in Adyen’s multi-100 TB production database.
Friday: Other advanced Topics
Nicholas Meyer (Academia.edu) introduced thin cloning, a technique for giving developers real production data snapshots for debugging. Using tools like DBLab Engine or Amazon Aurora’s clone feature, thin cloning creates writable copies of live data inexpensively. This lets developers reproduce production issues exactly – including data-dependent bugs – by debugging against these clones of real data. Nicholas explained how Academia.edu uses thin clones to catch subtle bugs early by having dev and QA teams work with near-production data.
Dave Pitts (Adyen) explained why future Postgres applications may use both B-tree and LSM-tree (log-structured) indexes. He outlined the fundamental differences: B-trees excel at point lookups and balanced reads/writes, while LSM-trees optimise high write throughput and range scans. Dave discussed “gotchas” when switching workloads between index types. The talk clarified when each structure is advantageous, helping developers and DBAs choose the right index for their workload.

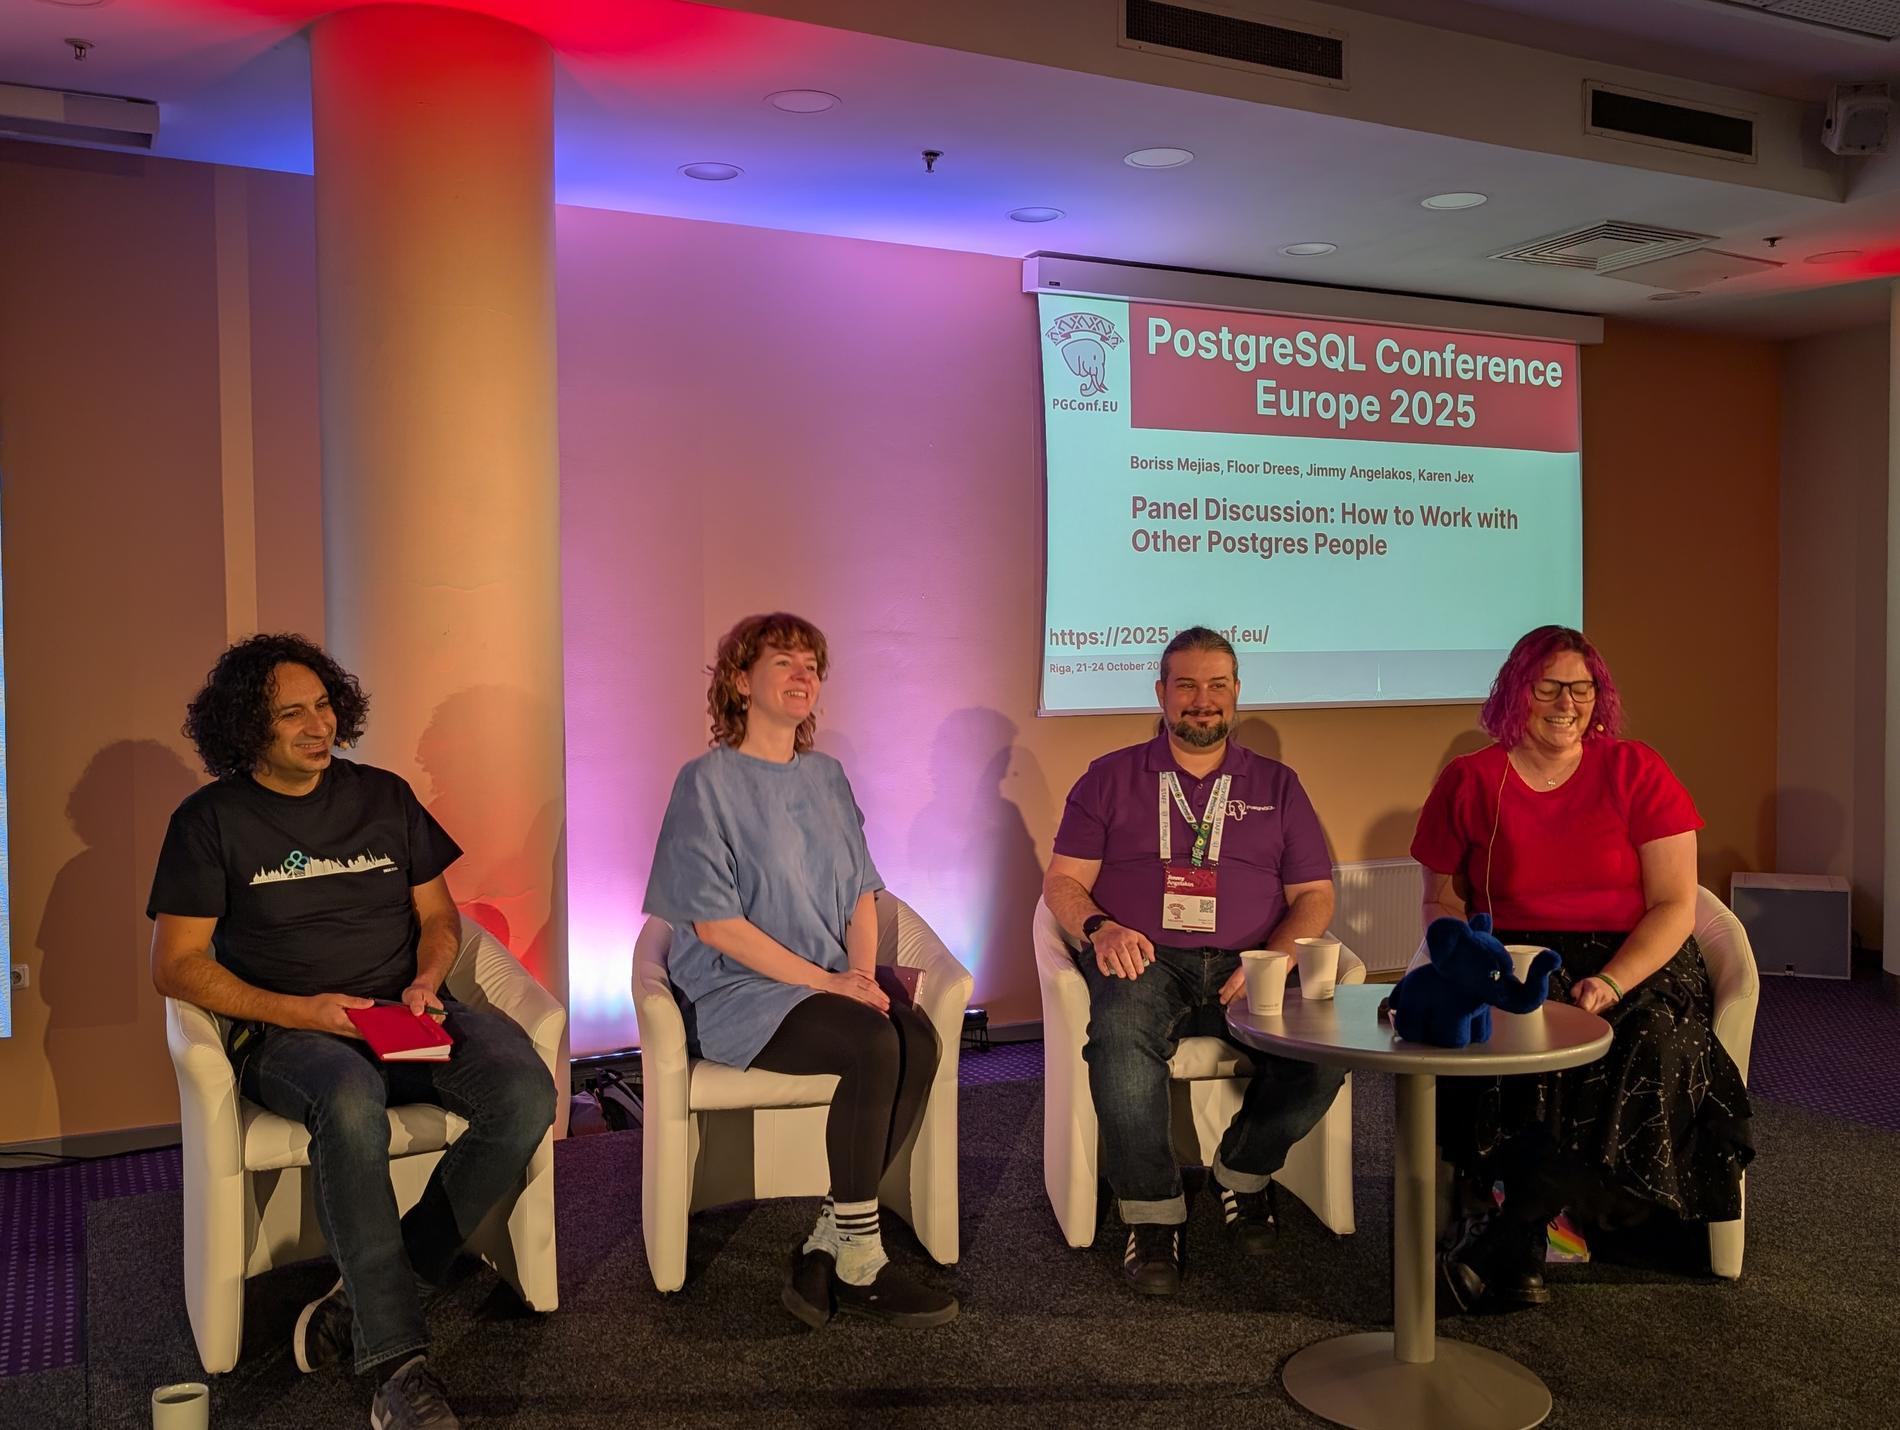
A panel led by Jimmy Angelakos addressed “How to Work with Other Postgres People”. The discussion focused on mental health, burnout, and neurodiversity in the PostgreSQL community. Panelists highlighted that unaddressed mental-health issues cause stress and turnover in open-source projects. They shared practical strategies for a more supportive culture: personal “README” guides to explain individual communication preferences, respectful and empathetic communication practices, and concrete conflict resolution techniques. The goal was to make the Postgres community more welcoming and resilient by understanding diverse needs and supporting contributors effectively.
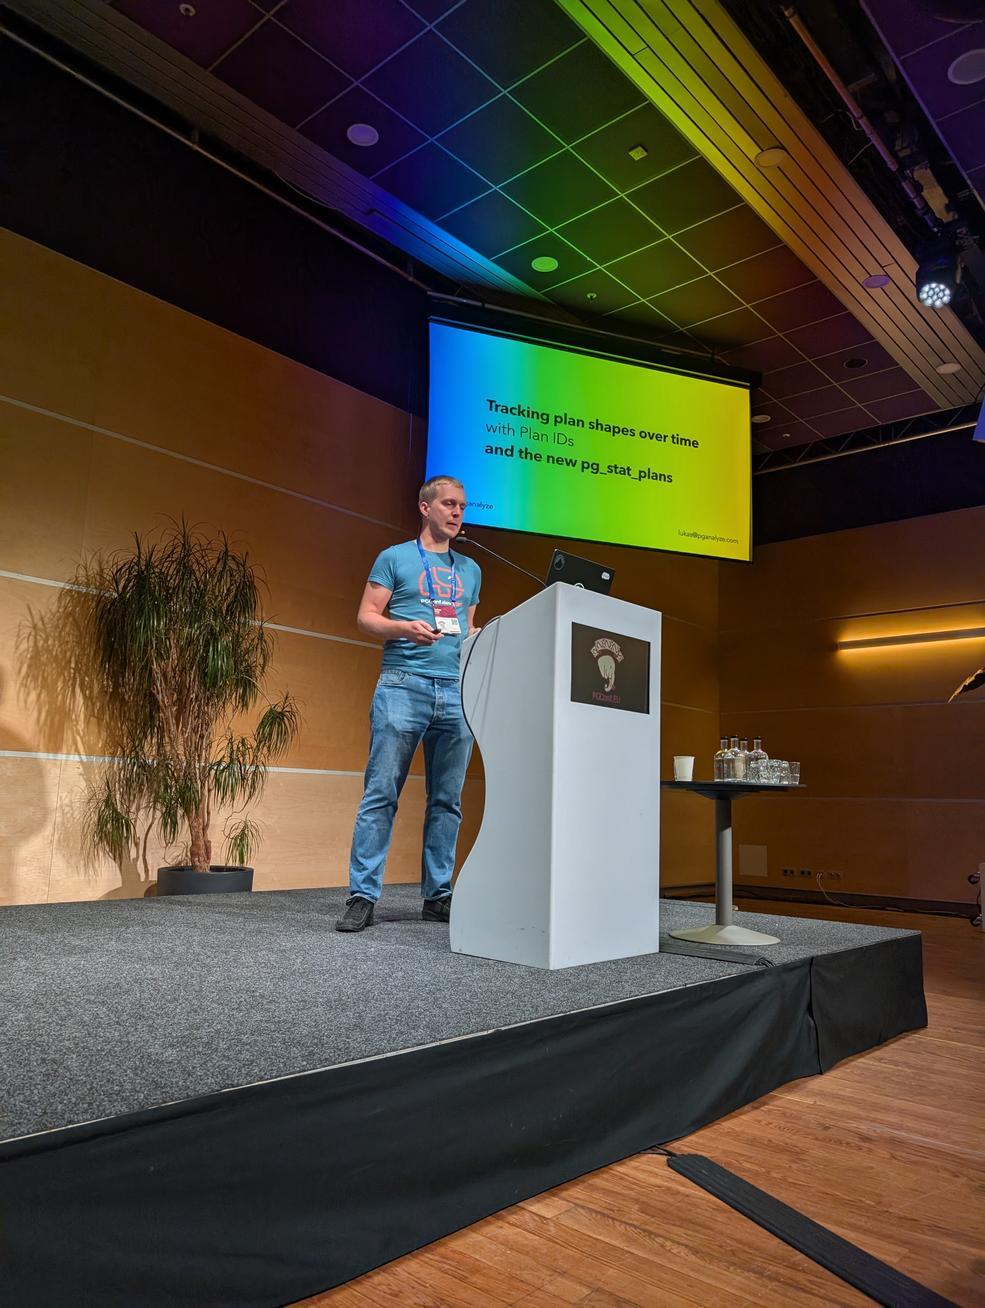
Lukas Fittl (pganalyze) presented new tools for tracking query plan changes over time. He showed how to assign stable Plan IDs (analogous to query IDs) so that DBAs can monitor which queries use which plan shapes. Lukas introduced the new pg_stat_plans extension (leveraging Postgres 18’s features) for low-overhead collection of plan statistics. He explained how this extension works and compared it to older tools (the original pg_stat_plans, pg_store_plans, etc.) and cloud provider implementations. This makes it easier to detect when a query’s execution plan changes in production, aiding performance troubleshooting.
Ahsan Hadi (pgEdge) described pgEdge Enterprise PostgreSQL, a 100% open-source distributed Postgres platform. pgEdge Enterprise Postgres provides built-in high availability (using Patroni and read replicas) and the ability to scale across global regions. Starting from a single-node Postgres, users can grow to a multi-region cluster with geo-distributed replicas for extreme availability and low latency. Ahsan demonstrated how pgEdge is designed for organizations that need to scale from single instances to large distributed deployments, all under the standard Postgres license.
Conclusion
PGConf.EU 2025 was an excellent event for sharing knowledge and learning from the global PostgreSQL community. I was proud to represent credativ and to help as a volunteer, and I’m grateful for the many insights gained. The sessions above represent just a selection of the rich content covered at the conference. Overall, PostgreSQL’s strong community and rapid innovation continue to make these conferences highly valuable. I look forward to applying what I learned in my work and to attending future PGConf.EU events.
As I explained in my talk on PostgreSQL Conference Europe 2025, data corruption can be silently present in any PostgreSQL database and will remain undetected until we physically read corrupted data. There can be many reasons why some data blocks in tables or other objects can be damaged. Even modern storage hardware is far from being infallible. Binary backups done with pg_basebackup tool – which is very common backup strategy in PostgreSQL environment – leave these problems hidden. Because they do not check data but copy whole data files as they are. With release of PostgreSQL 18, the community decided to turn on data‑checksums by default – a major step toward early detection of these failures. This post examines how PostgreSQL implements checksums, how it handles checksum failures, and how we can enable them on existing clusters.
Many companies these days are thinking about migrating their databases from legacy or proprietary system to PostgreSQL. The primary aim is to reduce costs, enhance capabilities, and ensure long-term sustainability. However, even just the idea of migrating to PostgreSQL can be overwhelming. Very often, knowledge about the legacy applications is limited or even lost. In some cases, vendor support is diminishing, and expert pools and community support are shrinking. Legacy databases are also often running on outdated hardware and old operating systems, posing further risks and limitations. (more…)
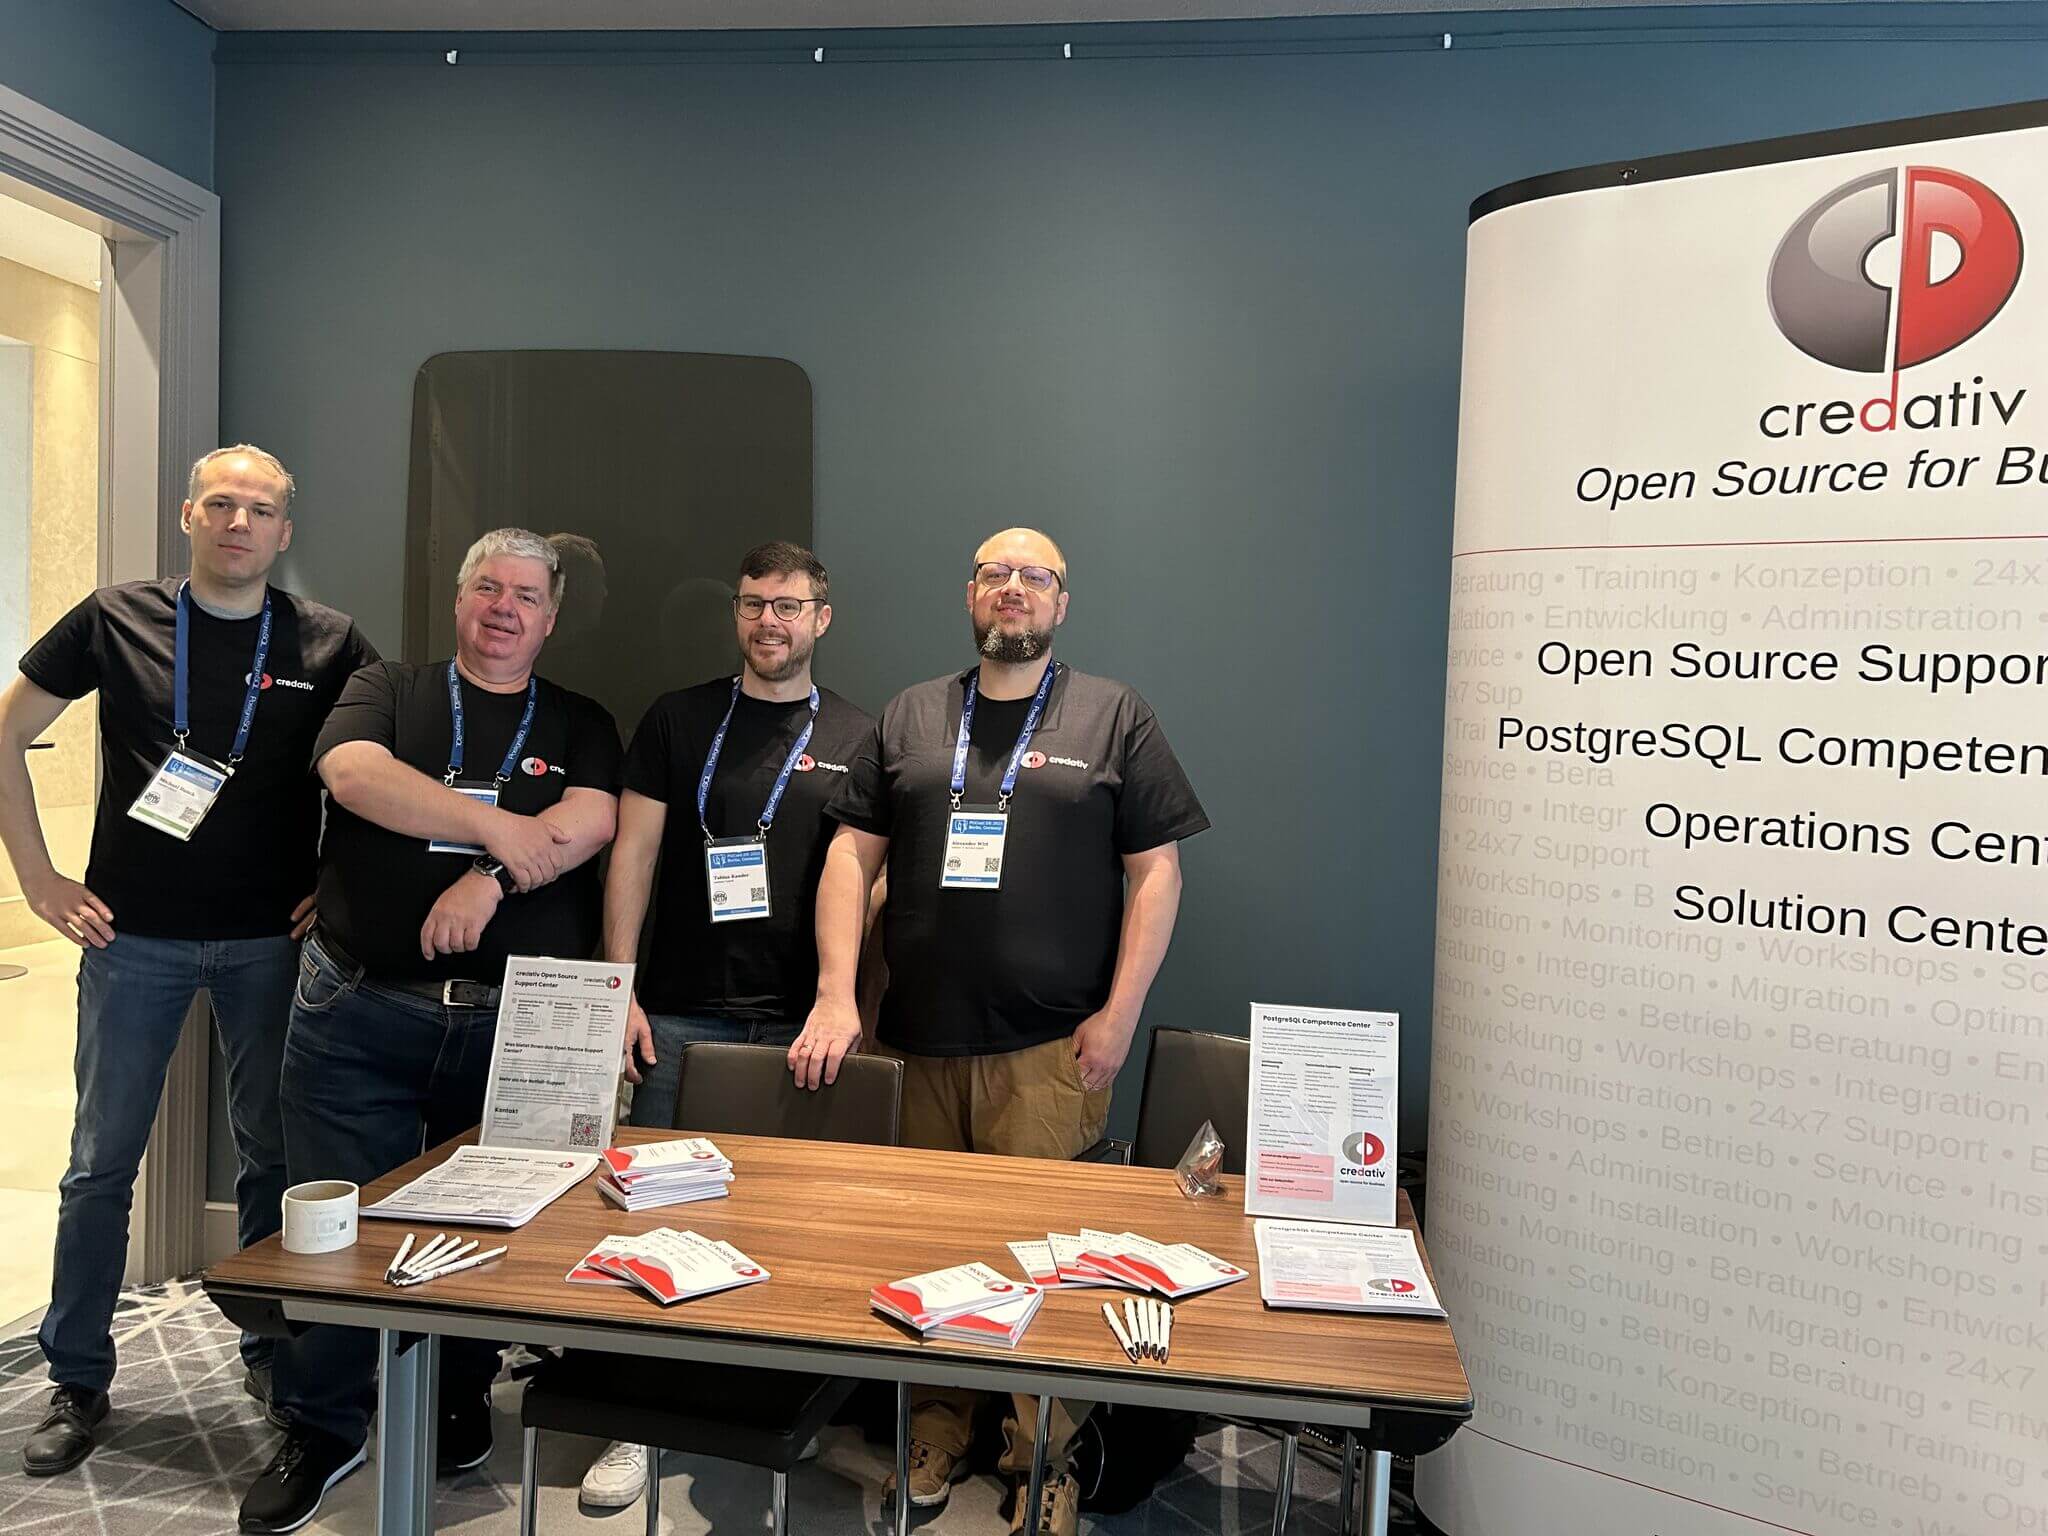
PGConf.DE 2025, the 9th Annual PostgreSQL Conference Germany, was held on May 8–9, 2025, at the Marriott Hotel near Potsdamer Platz in Berlin. The event interconnected PostgreSQL enthusiasts, developers, DBAs, and industry sponsors for two days of fascinating talks across four parallel tracks. It was the biggest event so far, with 347 attendees. The whole conference was very well organized, and therefore special thanks are due to all the organizers—in particular Andreas Scherbaum, the main organizer—for their efforts and hard work.
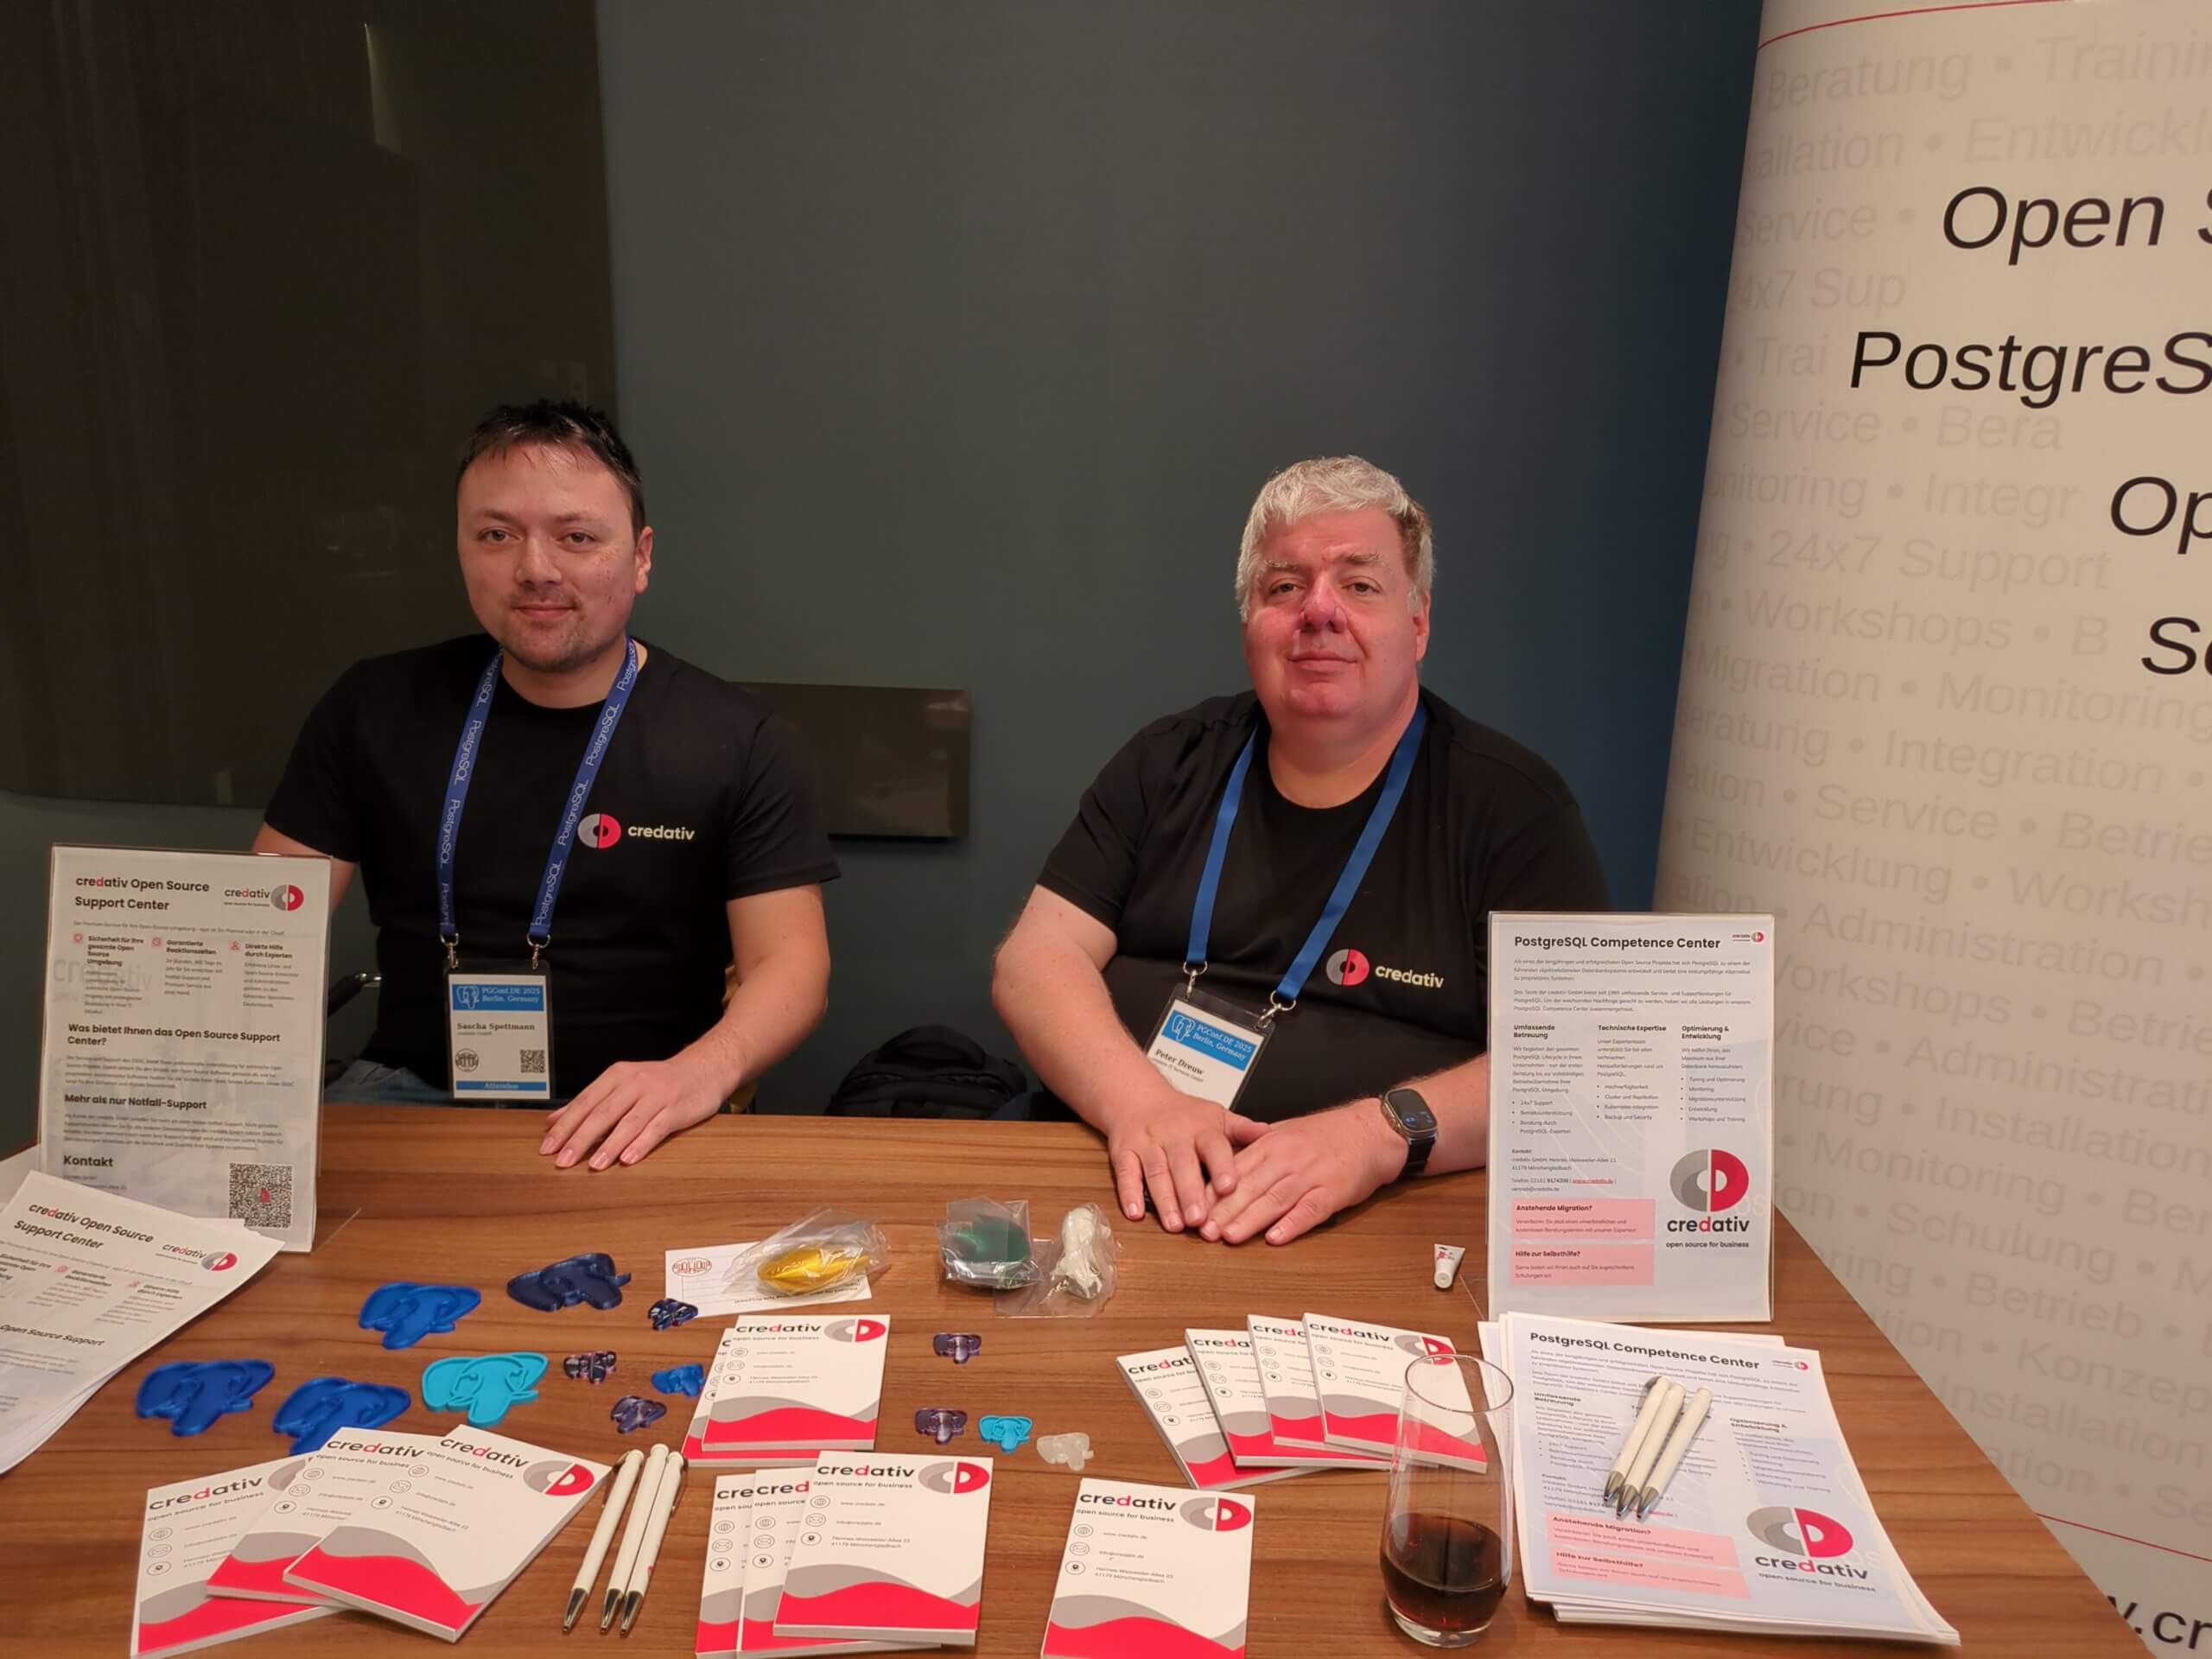
Our company, credativ GmbH, being independent again, participated as a gold sponsor. The credativ CTO Alexander Wirt, Head of Sales & Marketing Peter Dreuw and team leader of Database team Tobias Kauder, were available for attendees at the credativ booth. Many thanks to our team colleague Sascha Spettmann for delivering all the stands and billboards to the conference and back again.
In total, we held four talks at the conference. Michael Banck, technical leader of our database team, presented the German-language talk “PostgreSQL Performance Tuning.” He provided a deep and comprehensive overview of the most important performance-tuning parameters in PostgreSQL and explained how they influence the database’s behavior. His talk attracted a large audience and was very well received.
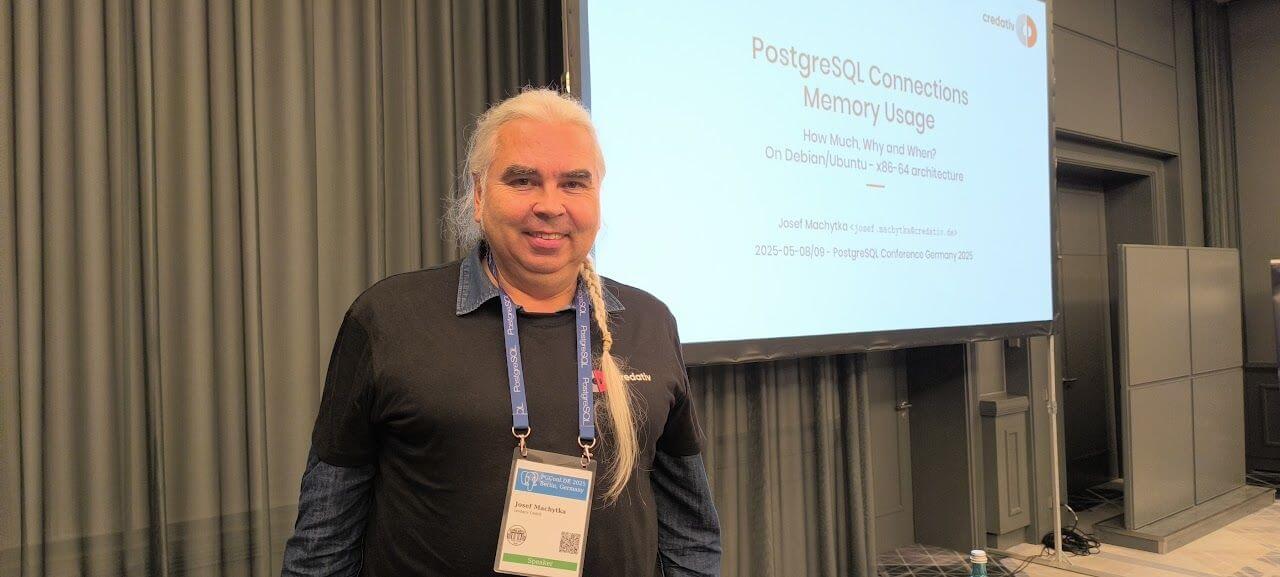
I had an absolutely unique opportunity to present three different talks in the English track. In my regular talk “PostgreSQL Connections Memory Usage: How Much, Why and When,” I presented the results of my research and tests on PostgreSQL connections’ memory usage. After explaining the most important aspects of Linux memory management and measurements of memory usage reported by standard commands, I detailed PostgreSQL connection memory usage during query execution based on numbers reported in smaps files. I intend to publish detailed blog posts about my findings soon. My other talk, “Building a Data Lakehouse with PostgreSQL,” was originally chosen as a reserve talk in case of a last-minute cancellation. Unfortunately, this indeed happened: the talk “Creating a Board Game Chatbot with Postgres, AI, and RAG” by Matt Cornillon had to be replaced. The speaker could not attend because his flight was unexpectedly canceled at very short notice.
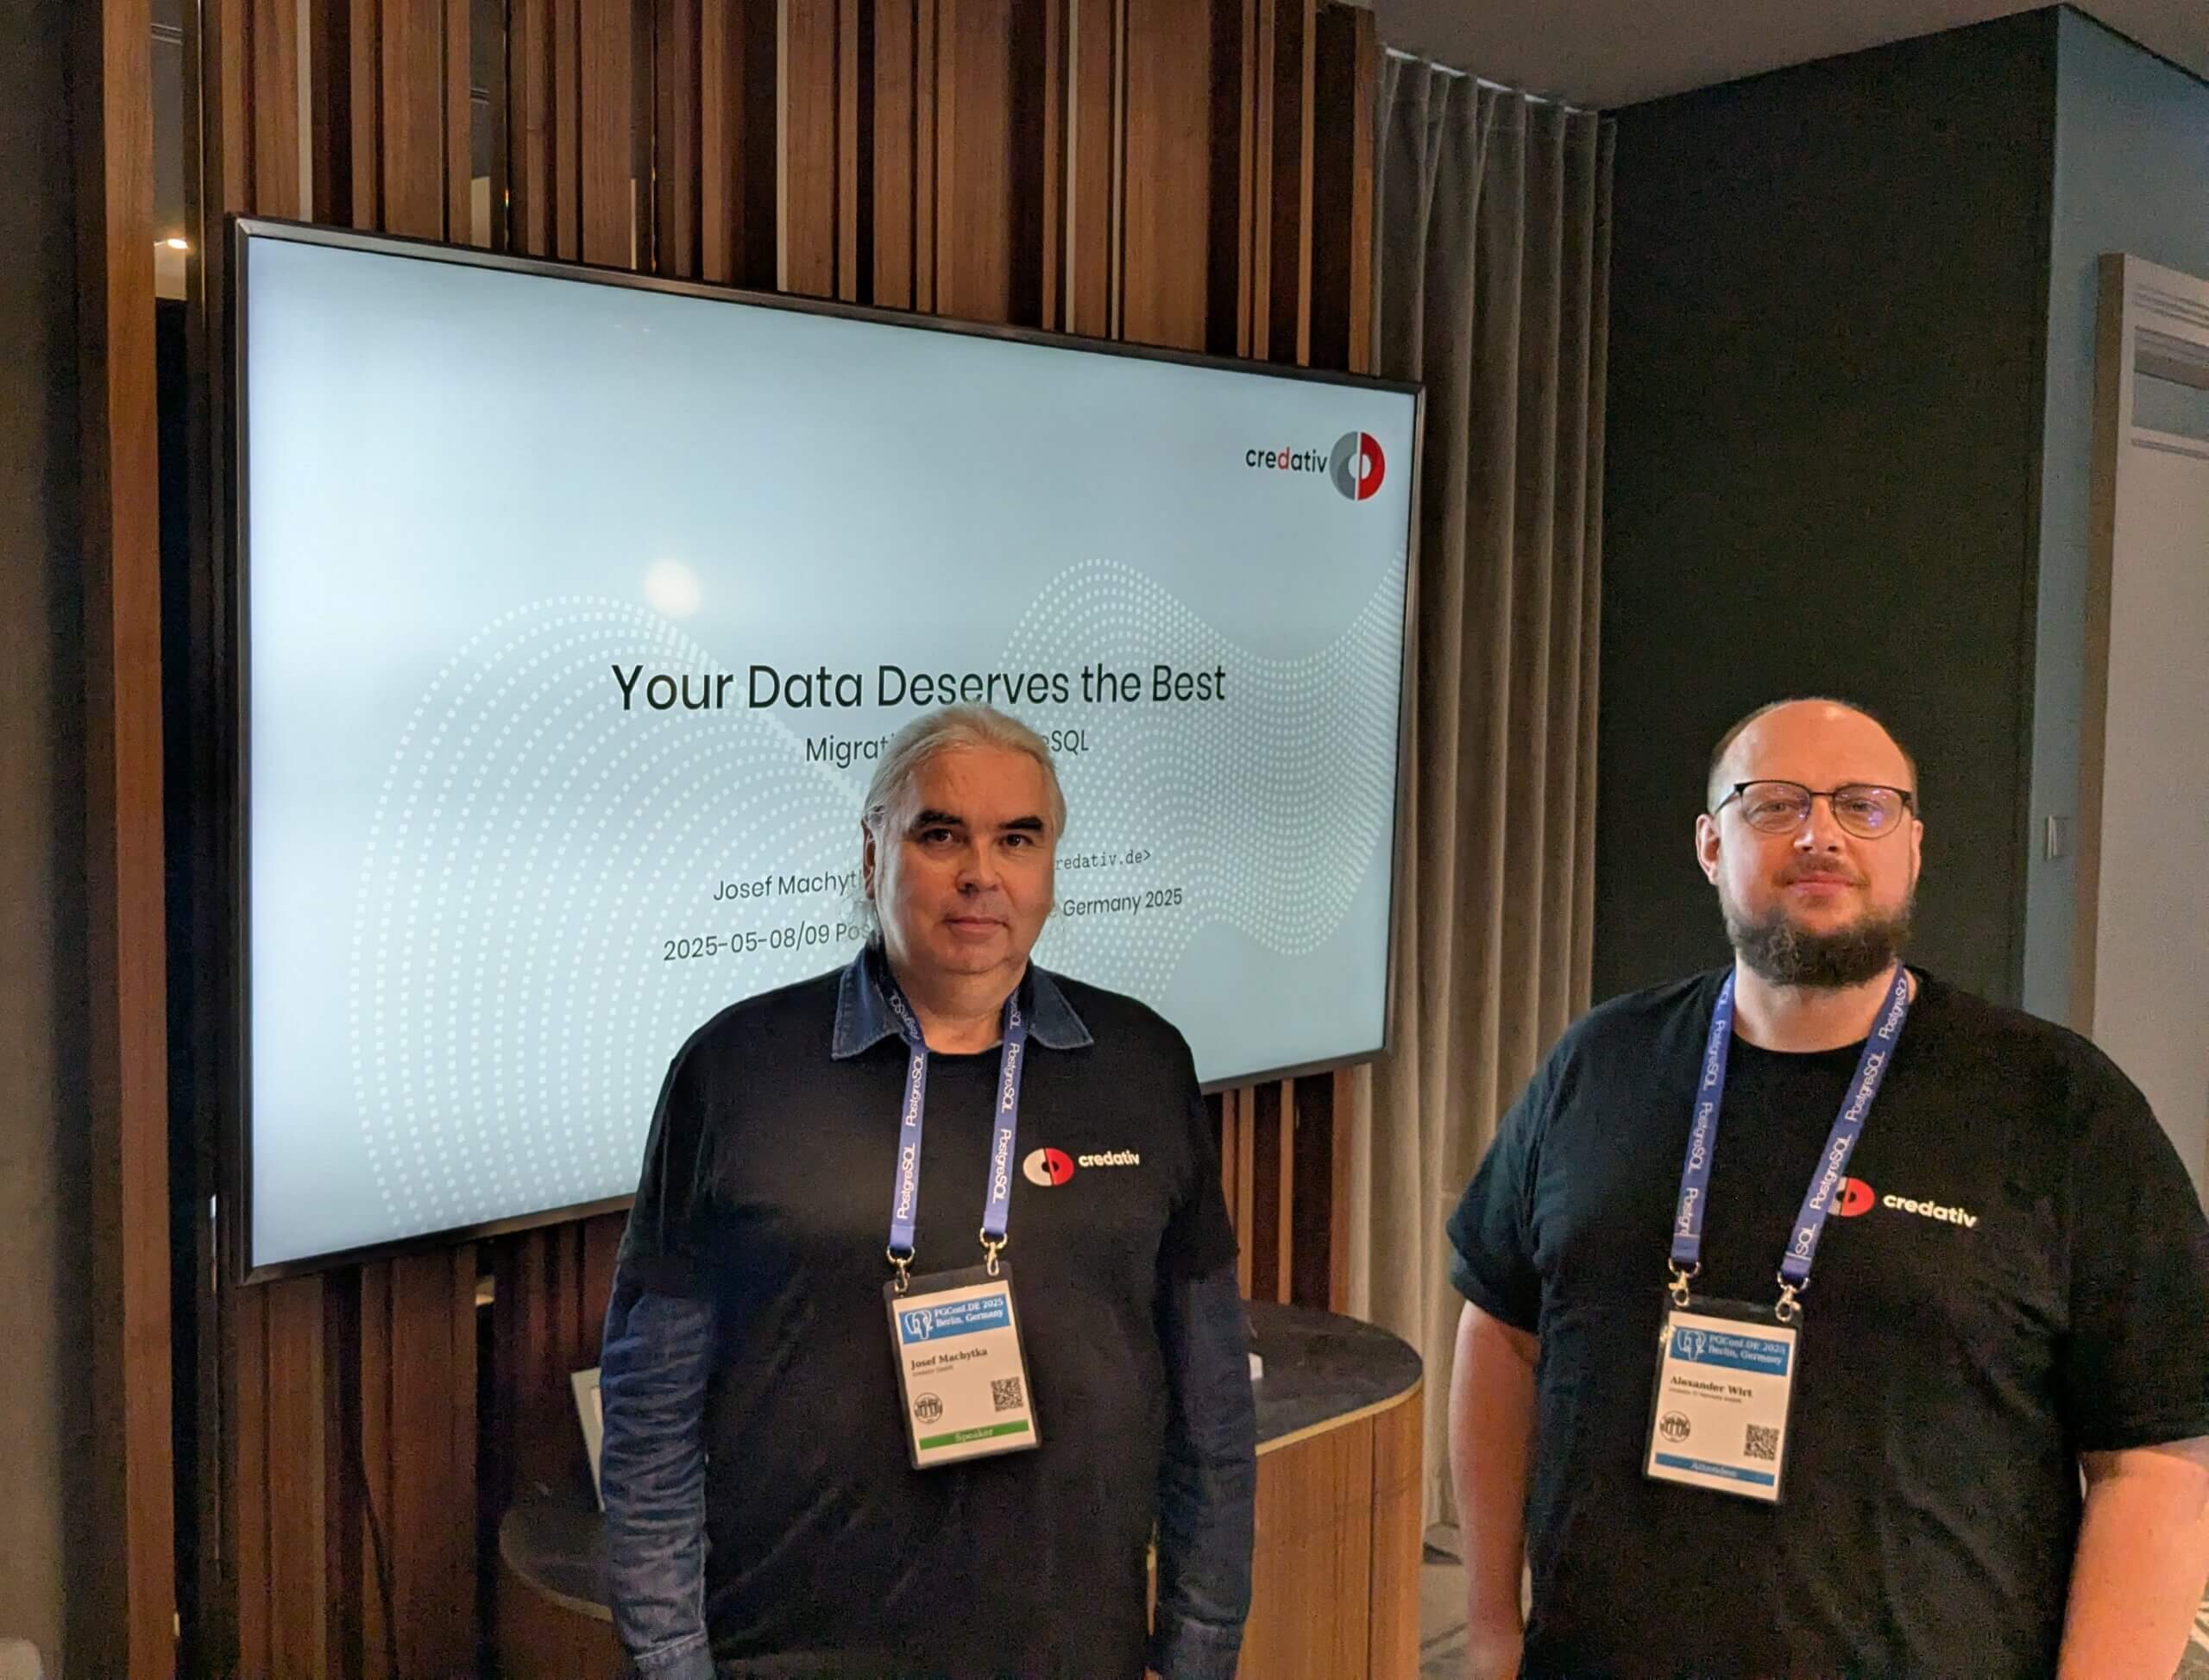
In the sponsor track, credativ CTO Alexander Wirt and I presented a talk titled “Your Data Deserves the Best: Migration to PostgreSQL.” It featured our new migration tool, “credativ-pg-migrator.” It is capable of migrating data models (tables, data, indexes, constraints, and views) from Informix, IBM DB2 LUW, MS SQL Server, Sybase ASE, SQL Anywhere, and MySQL/MariaDB. In the case of Informix, it can also convert stored procedures, functions, and triggers into PostgreSQL PL/pgSQL. We will share more details about this tool in a separate blog post.
Since there were always three or four parallel talks, I had to carefully choose which sessions to attend. I greatly enjoyed the talk “András in Windowsland – a DBA’s (mis)adventures” by András Váczi from Cybertec. The speaker presented many useful tips for accessing and troubleshooting PostgreSQL on Windows. I also enjoyed the German talk “Modern VACUUM,” delivered by Christoph Berg from Cybertec. He provided valuable insights into the history and implementation details of the VACUUM command and autovacuum background processes. Another very interesting talk was the German presentation “Modernes SSL ideal einsetzen” by Peter Eisentraut from EDB. The talk covered selecting appropriate protocol versions and cryptographic cipher suites, managing keys and certificates, and configuring client/server settings to meet contemporary security standards. The talk “Comparing the Oracle and PostgreSQL transaction systems,” delivered by Laurenz Albe from Cybertec, received a lot of well-deserved attention. Key topics included Oracle’s undo/redo mechanism versus PostgreSQL’s MVCC approach, differences in isolation level defaults and anomalies, and how each database implements constraints and transactional DDL. Last but not least, I want to mention the talk “What is an SLRU anyway?” delivered by major PostgreSQL contributor Álvaro Herrera. He explained that SLRUs are essentially circular logs with an in-memory cache used for tracking information such as committed transactions or snapshot data and he highlighted the significance of PostgreSQL 17’s innovations which made SLRU cache sizes configurable. Unfortunately, the talks were not recorded, but slides for the majority of the talks are already available on the conference website.
The whole event was highly informative and provided excellent networking opportunities. We are very much looking forward to participating in the next PGConf.DE. In the meantime, stay tuned to all credativ news, follow us on social media – LinkedIn and Mastodon.
If you are interested in our PostgreSQL related services, click here!
Version 17 of PostgreSQL has been released for a while. One of the many features is a change by Tom Lane called “Rearrange pg_dump’s handling of large objects for better efficiency”. In the past, we have seen our customers have several problems with a large number of large objects being a performance issue for dump/restore. The main reason for this is that large objects are quite unlike to TOAST (The Oversized Attribute Storage Technique): while TOASTed data is completely transparent to the user, large objects are stored out-of-line in a pg_largeboject table with a link to the particular row in that table being an OID in the table itself.
Introduction To Large
Objects
Here is an example on how large objects can be used:
postgres=# CREATE TABLE test(id BIGINT, blob OID);
CREATE TABLE
postgres=# INSERT INTO test VALUES (1, lo_import('/etc/issue.net'));
INSERT 0 1
postgres=# SELECT * FROM test;
 id | blob
----+-------
  1 | 33280
(1 row)

postgres=# SELECT * FROM pg_largeobject;
 loid  | pageno |                    data
-------+--------+--------------------------------------------
 33280 |      0 | \x44656269616e20474e552f4c696e75782031320a
(1 row)

postgres=# SELECT lo_export(test.blob, '/tmp/foo') FROM test;
 lo_export
-----------
         1
(1 row)

postgres=# SELECT pg_read_file('/tmp/foo');
    pg_read_file
---------------------
 Debian GNU/Linux 12+

(1 row)

postgres=# INSERT INTO test VALUES (1, lo_import('/etc/issue.net'));
INSERT 0 1
Now if we dump the database in custom format with both version 16 and 17 of pg_dump and then use pg_restore -l to display the table of contents (TOC), we see a difference:
$ for version in 16 17; do /usr/lib/postgresql/$version/bin/pg_dump -Fc -f lo_test_$version.dmp; \
> pg_restore -l lo_test_$version.dmp | grep -v ^\; > lo_test_$version.toc; done
$ diff -u lo_test_{16,17}.toc
--- lo_test_16.toc  2024-12-11 09:05:46.550667808 +0100
+++ lo_test_17.toc  2024-12-11 09:05:46.594670235 +0100
@@ -1,5 +1,4 @@
 215; 1259 33277 TABLE public test postgres
-3348; 2613 33280 BLOB - 33280 postgres
-3349; 2613 33281 BLOB - 33281 postgres
+3348; 2613 33280 BLOB METADATA - 33280..33281 postgres
 3347; 0 33277 TABLE DATA public test postgres
-3350; 0 0 BLOBS - BLOBS
+3349; 0 0 BLOBS - 33280..33281 postgres
The dump with version 17 combines the large object metadata into BLOB METADATA, creating only one entry in the TOC for them.
Further, if we use the directory dump format, we see that pg_dump creates a file for each large object:
$ pg_dump -Fd -f lo_test.dir
$ ls lo_test.dir/
3347.dat.gz  blob_33280.dat.gz  blob_33281.dat.gz  blobs.toc  toc.dat
If there are only a few large objects, this is not a problem. But if the large object mechanism is used to create hundreds of thousands or millions of large objects, this will become a serious problem for pg_dump/pg_restore.
Finally, in order to fully remove the large objects, it does not suffice to drop the table, the large object needs to be unlinked as well:
postgres=# DROP TABLE test;
DROP TABLE
postgres=# SELECT COUNT(*) FROM pg_largeobject;
 count
-------
     2
(1 row)

postgres=# SELECT lo_unlink(loid) FROM pg_largeobject;
 lo_unlink
-----------
         1
         1
(2 rows)

postgres=# SELECT COUNT(*) FROM pg_largeobject;
 count
-------
     0
(1 row)
Benchmark
We generate one million large objects in a PostgreSQL 16 instance:
lotest=# SELECT lo_create(id) FROM generate_series(1,1000000) AS id;
 lo_create
-----------
         1
         2
[...]
    999999
   1000000
(1000000 rows)

lotest=# SELECT COUNT(*) FROM pg_largeobject_metadata;
  count
---------
 1000000
(1 row)
(1 row)
We now dump the database with pg_dump from both version 16 and 17, first as a custom and then as a directory dump, using the time utility to track runtime and memory usage:
$ for version in 16 17; do echo -n "$version: "; \
> /usr/bin/time -f '%E %Mk mem' /usr/lib/postgresql/$version/bin/pg_dump \
> -Fc -f lo_test_$version.dmp lotest; done
16: 0:36.73 755692k mem
17: 0:34.69 217776k mem
$ for version in 16 17; do echo -n "$version: "; \
> /usr/bin/time -f '%E %Mk mem' /usr/lib/postgresql/$version/bin/pg_dump \
> -Fd -f lo_test_$version.dir lotest; done
16: 8:23.48 755624k mem
17: 7:51.04 217980k mem
Dumping using the directory format takes much longer than with the custom format, while the amount of memory is very similar for both. The runtime is slightly lower for version 17 compared to version 16, but the big difference is in the used memory, which is 3,5x smaller.
Also, when looking at the file size for the custom dump or the file size of the table-of-contents (TOC) file, the difference becomes very clear:
$ ls -lh lo_test_1?.dmp | awk '{print $5 " " $9}'
211M lo_test_16.dmp
29M lo_test_17.dmp
$ ls -lh lo_test_1?.dir/toc.dat | awk '{print $5 " " $9}'
185M lo_test_16.dir/toc.dat
6,9M lo_test_17.dir/toc.dat
The custom dump is roughly 7x smaller while the TOC file of the directory dump is around 25x smaller. We also tested for different numbers of large objects (from 50k to 1.5 million) and found only a slight variance in those ratios: the used memory ratio increases from around 2x at 50k to 4x at 1.5 million while the TOC ratio goes down from around 30x at 50k to 25x at 1.5 million.
Conclusion
The changes regarding dumps of large objects in Postgres 17 are very welcome for users with a huge number of large objects. Memory requirements are much lower on PostgreSQL 17 compared to earlier versions, both for dumps in custom and directory format.
Unfortunately, neither the number of files in the directory nor the directory size changes much, each large object is still dumped as its own file, which can lead to problems if there are a lot files:
$ for version in 16 17; do echo -n "$version: "; find lo_test_$version.dir/ | wc -l; done
16: 1000003
17: 1001002
$ du -s -h lo_test_??.dir
4,1G    lo_test_16.dir
3,9G    lo_test_17.dir
This might be an area for future improvements in Postgres 18 and beyond.
The issue of table and index bloat due to failed inserts on unique constraints is well known and has been discussed in various articles across the internet. However, these discussions sometimes lack a clear, practical example with measurements to illustrate the impact. And despite the familiarity of this issue, we still frequently see this design pattern—or rather, anti-pattern—in real-world applications. Developers often rely on unique constraints to prevent duplicate values from being inserted into tables. While this approach is straightforward, versatile, and generally considered effective, in PostgreSQL, inserts that fail due to unique constraint violations unfortunately always lead to table and index bloat. And on high-traffic systems, this unnecessary bloat can significantly increase disk I/O and the frequency of autovacuum runs. In this article, we aim to highlight this problem once again and provide a straightforward example with measurements to illustrate it. We suggest simple improvement that can help mitigate this issue and reduce autovacuum workload and disk I/O.
Two Approaches to Duplicate Prevention
In PostgreSQL, there are two main ways to prevent duplicate values using unique constraints:
1. Standard Insert Command (INSERT INTO table)
The usual INSERT INTO table command attempts to insert data directly into the table. If the insert would result in a duplicate value, it fails with a “duplicate key value violates unique constraint” error. Since the command does not specify any duplicate checks, PostgreSQL internally immediately inserts the new row and only then begins updating indexes. When it encounters a unique index violation, it triggers the error and deletes the newly added row. The order of index updates is determined by their relation IDs, so the extent of index bloat depends on the order in which indexes were created. With repeated “unique constraint violation” errors, both the table and some indexes accumulate deleted records leading to bloat, and the resulting write operations increase disk I/O without achieving any useful outcome.
2. Conflict-Aware Insert (INSERT INTO table … ON CONFLICT DO NOTHING)
The INSERT INTO table ON CONFLICT DO NOTHING command behaves differently. Since it specifies that a conflict might occur, PostgreSQL first checks for potential duplicates before attempting to insert data. If a duplicate is found, PostgreSQL performs the specified action—in this case, “DO NOTHING”—and no error occurs. This clause was introduced in PostgreSQL 9.5, but some applications either still run on older PostgreSQL versions or retain legacy code when the database is upgraded. As a result, this conflict-handling option is often underutilized.
Testing Example
To be able to do testing we must start PostgreSQL with “autovacuum=off”. Otherwise with instance mostly idle, autovacuum will immediately process bloated objects and it would be unable to catch statistics. We create a simple testing example with multiple indexes:
CREATE TABLE IF NOT EXISTS test_unique_constraints(
  id serial primary key,
  unique_text_key text,
  unique_integer_key integer,
  some_other_bigint_column bigint,
  some_other_text_column text);

CREATE INDEX test_unique_constraints_some_other_bigint_column_idx ON test_unique_constraints (some_other_bigint_column );
CREATE INDEX test_unique_constraints_some_other_text_column_idx ON test_unique_constraints (some_other_text_column );
CREATE INDEX test_unique_constraints_unique_text_key_unique_integer_key__idx ON test_unique_constraints (unique_text_key, unique_integer_key, some_other_bigint_column );
CREATE UNIQUE test_unique_constraints_unique_integer_key_idx INDEX ON test_unique_constraints (unique_text_key );
CREATE UNIQUE test_unique_constraints_unique_text_key_idx INDEX ON test_unique_constraints (unique_integer_key );
And now we populate this table with unique data:
DO $$
BEGIN
  FOR i IN 1..1000 LOOP
    INSERT INTO test_unique_constraints
    (unique_text_key, unique_integer_key, some_other_bigint_column, some_other_text_column)
    VALUES (i::text, i, i, i::text);
  END LOOP;
END;
$$;
In the second step, we use a simple Python script to connect to the database, attempt to insert conflicting data, and close the session after an error. First, it sends 10,000 INSERT statements that conflict with the “test_unique_constraints_unique_int_key_idx” index, then another 10,000 INSERTs conflicting with “test_unique_constraints_unique_text_key_idx”. The entire test is done in a few dozen seconds, after which we inspect all objects using the “pgstattuple” extension. The following query lists all objects in a single output:
WITH maintable AS (SELECT oid, relname FROM pg_class WHERE relname = 'test_unique_constraints')
SELECT m.oid as relid, m.relname as relation, s.*
FROM maintable m
JOIN LATERAL (SELECT * FROM pgstattuple(m.oid)) s ON true
UNION ALL
SELECT i.indexrelid as relid, indexrelid::regclass::text as relation, s.*
FROM pg_index i
JOIN LATERAL (SELECT * FROM pgstattuple(i.indexrelid)) s ON true
WHERE i.indrelid::regclass::text = 'test_unique_constraints'
ORDER BY relid;
Observed Results
After running the whole test several times, we observe the following:
- The main table “test_unique_constraints” always has 1,000 live tuples, and 20,000 additional dead records, resulting in approx 85% of dead tuples in the table
- Index on primary key always shows 21,000 tuples, unaware that 20,000 of these records are marked as deleted in the main table.
- Other non unique indexes show different results in different runs, ranging between 3,000 and 21,000 records. Numbers depend on the distribution of values generated for underlying columns by the script. We tested both repeated and completely unique values. Repeated values resulted in less records in indexes, completely unique values led to full count of 21,000 records in these indexes.
- Unique indexes showed repeatedly tuple counts only between 1,000 and 1,400 in all tests. Unique index on the “unique_text_key” always shows some dead tuples in the output. Precise explanation of these numbers would require deeper inspection of these relations and code of the pgstattuple function, which is beyond scope of this article. But some small bloat is reported also here.
- Numbers reported by pgstattuple function raised questions about their accuracy, although documentation seems to lead to the conclusion that numbers should be precise on tuple level.
- Subsequent manual vacuum confirms 20,000 dead records in the main table and 54 pages removed from primary key index, and up to several dozens of pages removed from other indexes – different numbers in each run in dependency on total count of tuples in these relations as described above.
- Each failed insert also increments the Transaction ID and thus increases the database’s transaction age.
Here is one example output from the query shown above after the test run which used unique values for all columns. As we can see, bloat of non unique indexes due to failed inserts can be big.
 relid |                       relation                                  | table_len | tuple_count | tuple_len | tuple_percent | dead_tuple_count | dead_tuple_len | dead_tuple_percent | free_space | free_percent
-------+-----------------------------------------------------------------+-----------+-------------+-----------+---------------+------------------+----------------+--------------------+------------+--------------
 16418 | test_unique_constraints                                         |   1269760 |        1000 |     51893 |          4.09 |            20000 |        1080000 |              85.06 |       5420 |         0.43
 16424 | test_unique_constraints_pkey                                    |    491520 |       21000 |    336000 |         68.36 |                0 |              0 |                  0 |      51444 |        10.47
 16426 | test_unique_constraints_some_other_bigint_column_idx            |    581632 |       16396 |    326536 |         56.14 |                0 |              0 |                  0 |     168732 |        29.01
 16427 | test_unique_constraints_some_other_text_column_idx              |    516096 |       16815 |    327176 |         63.39 |                0 |              0 |                  0 |     101392 |        19.65
 16428 | test_unique_constraints_unique_text_key_unique_integer_key__idx |   1015808 |       21000 |    584088 |          57.5 |                0 |              0 |                  0 |     323548 |        31.85
 16429 | test_unique_constraints_unique_text_key_idx                     |     57344 |        1263 |     20208 |         35.24 |                2 |             32 |               0.06 |      15360 |        26.79
 16430 | test_unique_constraints_unique_integer_key_idx                  |     40960 |        1000 |     16000 |         39.06 |                0 |              0 |                  0 |       4404 |        10.75
(7 rows)
In a second test, we modify the script to include the ON CONFLICT DO NOTHING clause in the INSERT command and repeat both tests. This time, inserts do not result in errors; instead, they simply return “INSERT 0 0”, indicating that no records were inserted. Inspection of the Transaction ID after this test shows only a minimal increase, caused by background processes. Attempts to insert conflicting data did not result in increase of Transaction ID (XID), as PostgreSQL started first only virtual transaction to check for conflicts, and because a conflict was found, it aborted the transaction without having assigned a new XID. The “pgstattuple” output confirms that all objects contain only live data, with no dead tuples this time.
Summary
As demonstrated, each failed insert bloats the underlying table and some indexes, and increases the Transaction ID because each failed insert occurs in a separate transaction. Consequently, autovacuum is forced to run more frequently, consuming valuable system resources. Therefore applications still relying solely on plain INSERT commands without ON CONFLICT conditions should consider reviewing this implementation. But as always, the final decision should be based on the specific conditions of each application.
TOAST (The Oversized Attribute Storage Technique) is PostgreSQL‘s mechanism for handling large data objects that exceed the 8KB data page limit. Introduced in PostgreSQL 7.1, TOAST is an improved version of the out-of-line storage mechanism used in Oracle databases for handling large objects (LOBs). Both databases store variable-length data either inline within the table or in a separate structure. PostgreSQL limits the maximum size of a single tuple to one data page. When the size of the tuple, including compressed data in a variable-length column, exceeds a certain threshold, the compressed part is moved to a separate data file and automatically chunked to optimize performance.
 TOAST can be used for storing long texts, binary data in bytea columns, JSONB data, HSTORE long key-value pairs, large arrays, big XML documents, or custom-defined composite data types. Its behavior is influenced by two parameters: TOAST_TUPLE_THRESHOLD and TOAST_TUPLE_TARGET. The first is a hardcoded parameter defined in PostgreSQL source code in the heaptoast.h file, based on the MaximumBytesPerTuple function, which is calculated for four toast tuples per page, resulting in a 2000-byte limit. This hardcoded threshold prevents users from storing values that are too small in out-of-line storage, which would degrade performance. The second parameter, TOAST_TUPLE_TARGET, is a table-level storage parameter initialized to the same value as TOAST_TUPLE_THRESHOLD, but it can be adjusted for individual tables. It defines the minimum tuple length required before trying to compress and move long column values into TOAST tables.
In the source file heaptoast.h, a comment explains: “If a tuple is larger than TOAST_TUPLE_THRESHOLD, we will try to toast it down to no more than TOAST_TUPLE_TARGET bytes through compressing compressible fields and moving EXTENDED and EXTERNAL data out-of-line. The numbers need not be the same, though they currently are. It doesn’t make sense for TARGET to exceed THRESHOLD, but it could be useful to make it be smaller.” This means that in real tables, data stored directly in the tuple may or may not be compressed, depending on its size after compression. To check if columns are compressed and which algorithm is used, we can use the PostgreSQL system function pg_column_compression. Additionally, the pg_column_size function helps check the size of individual columns. PostgreSQL 17 introduces a new function, pg_column_toast_chunk_id, which indicates whether a column’s value is stored in the TOAST table.
In the latest PostgreSQL versions, two compression algorithms are used: PGLZ (PostgreSQL LZ) and LZ4. Both are variants of the LZ77 algorithm, but they are designed for different use cases. PGLZ is suitable for mixed text and numeric data, such as XML or JSON in text form, providing a balance between compression speed and ratio. It uses a sliding window mechanism to detect repeated sequences in the data, offering a reasonable balance between compression speed and compression ratio. LZ4, on the other hand, is a fast compression method designed for real-time scenarios. It offers high-speed compression and decompression, making it ideal for performance-sensitive applications. LZ4 is significantly faster than PGLZ, particularly for decompression, and processes data in fixed-size blocks (typically 64KB), using a hash table to find matches. This algorithm excels with binary data, such as images, audio, and video files.
In my internal research project aimed at understanding the performance of JSONB data under different use cases, I ran multiple performance tests on queries that process JSONB data. The results of some tests showed interesting and sometimes surprising performance differences between these algorithms. But presented examples are anecdotal and cannot be generalized. The aim of this article is to raise an awareness that there can be huge differences in performance, which vary depending on specific data and use cases and also on specific hardware. Therefore, these results cannot be applied blindly.
JSONB data is stored as a binary object with a tree structure, where keys and values are stored in separate cells, and keys at the same JSON level are stored in sorted order. Nested levels are stored as additional tree structures under their corresponding keys from the higher level. This structure means that retrieving data for the first keys in the top JSON layer is quicker than retrieving values for highly nested keys stored deeper in the binary tree. While this difference is usually negligible, it becomes significant in queries that perform sequential scans over the entire dataset, where these small delays can cumulatively degrade overall performance.
The dataset used for the tests consisted of GitHub historical events available as JSON objects from gharchive.org covering the first week of January 2023. I tested three different tables: one using PGLZ, one using LZ4, and one using EXTERNAL storage without compression. A Python script downloaded the data, unpacked it, and loaded it into the respective tables. Each table was loaded separately to prevent prior operations from influencing the PostgreSQL storage format.
The first noteworthy observation was the size difference between the tables. The table using LZ4 compression was the smallest, around 38GB, followed by the table using PGLZ at 41GB. The table using external storage without compression was significantly larger at 98GB. As the testing machines had only 32GB of RAM, none of the tables could fit entirely in memory, making disk I/O a significant factor in performance. About one-third of the records were stored in TOAST tables, which reflected a typical data size distribution seen by our clients.
To minimize caching effects, I performed several tests with multiple parallel sessions running testing queries, each with randomly chosen parameters. In addition to use cases involving different types of indexes, I also ran sequential scans across the entire table. Tests were repeated with varying numbers of parallel sessions to gather sufficient data points, and the same tests were conducted on all three tables with different compression algorithms.
The first graph shows the results of select queries performing sequential scans, retrieving JSON keys stored at the beginning of the JSONB binary object. As expected, external storage without compression (blue line) provides nearly linear performance, with disk I/O being the primary factor. On an 8-core machine, the PGLZ algorithm (red line) performs reasonably well under smaller loads. However, as the number of parallel queries reaches the number of available CPU cores (8), its performance starts to degrade and becomes worse than the performance of uncompressed data. Under higher loads, it becomes a serious bottleneck. In contrast, LZ4 (green line) handles parallel queries exceptionally well, maintaining better performance than uncompressed data, even with up to 32 parallel queries on 8 cores.
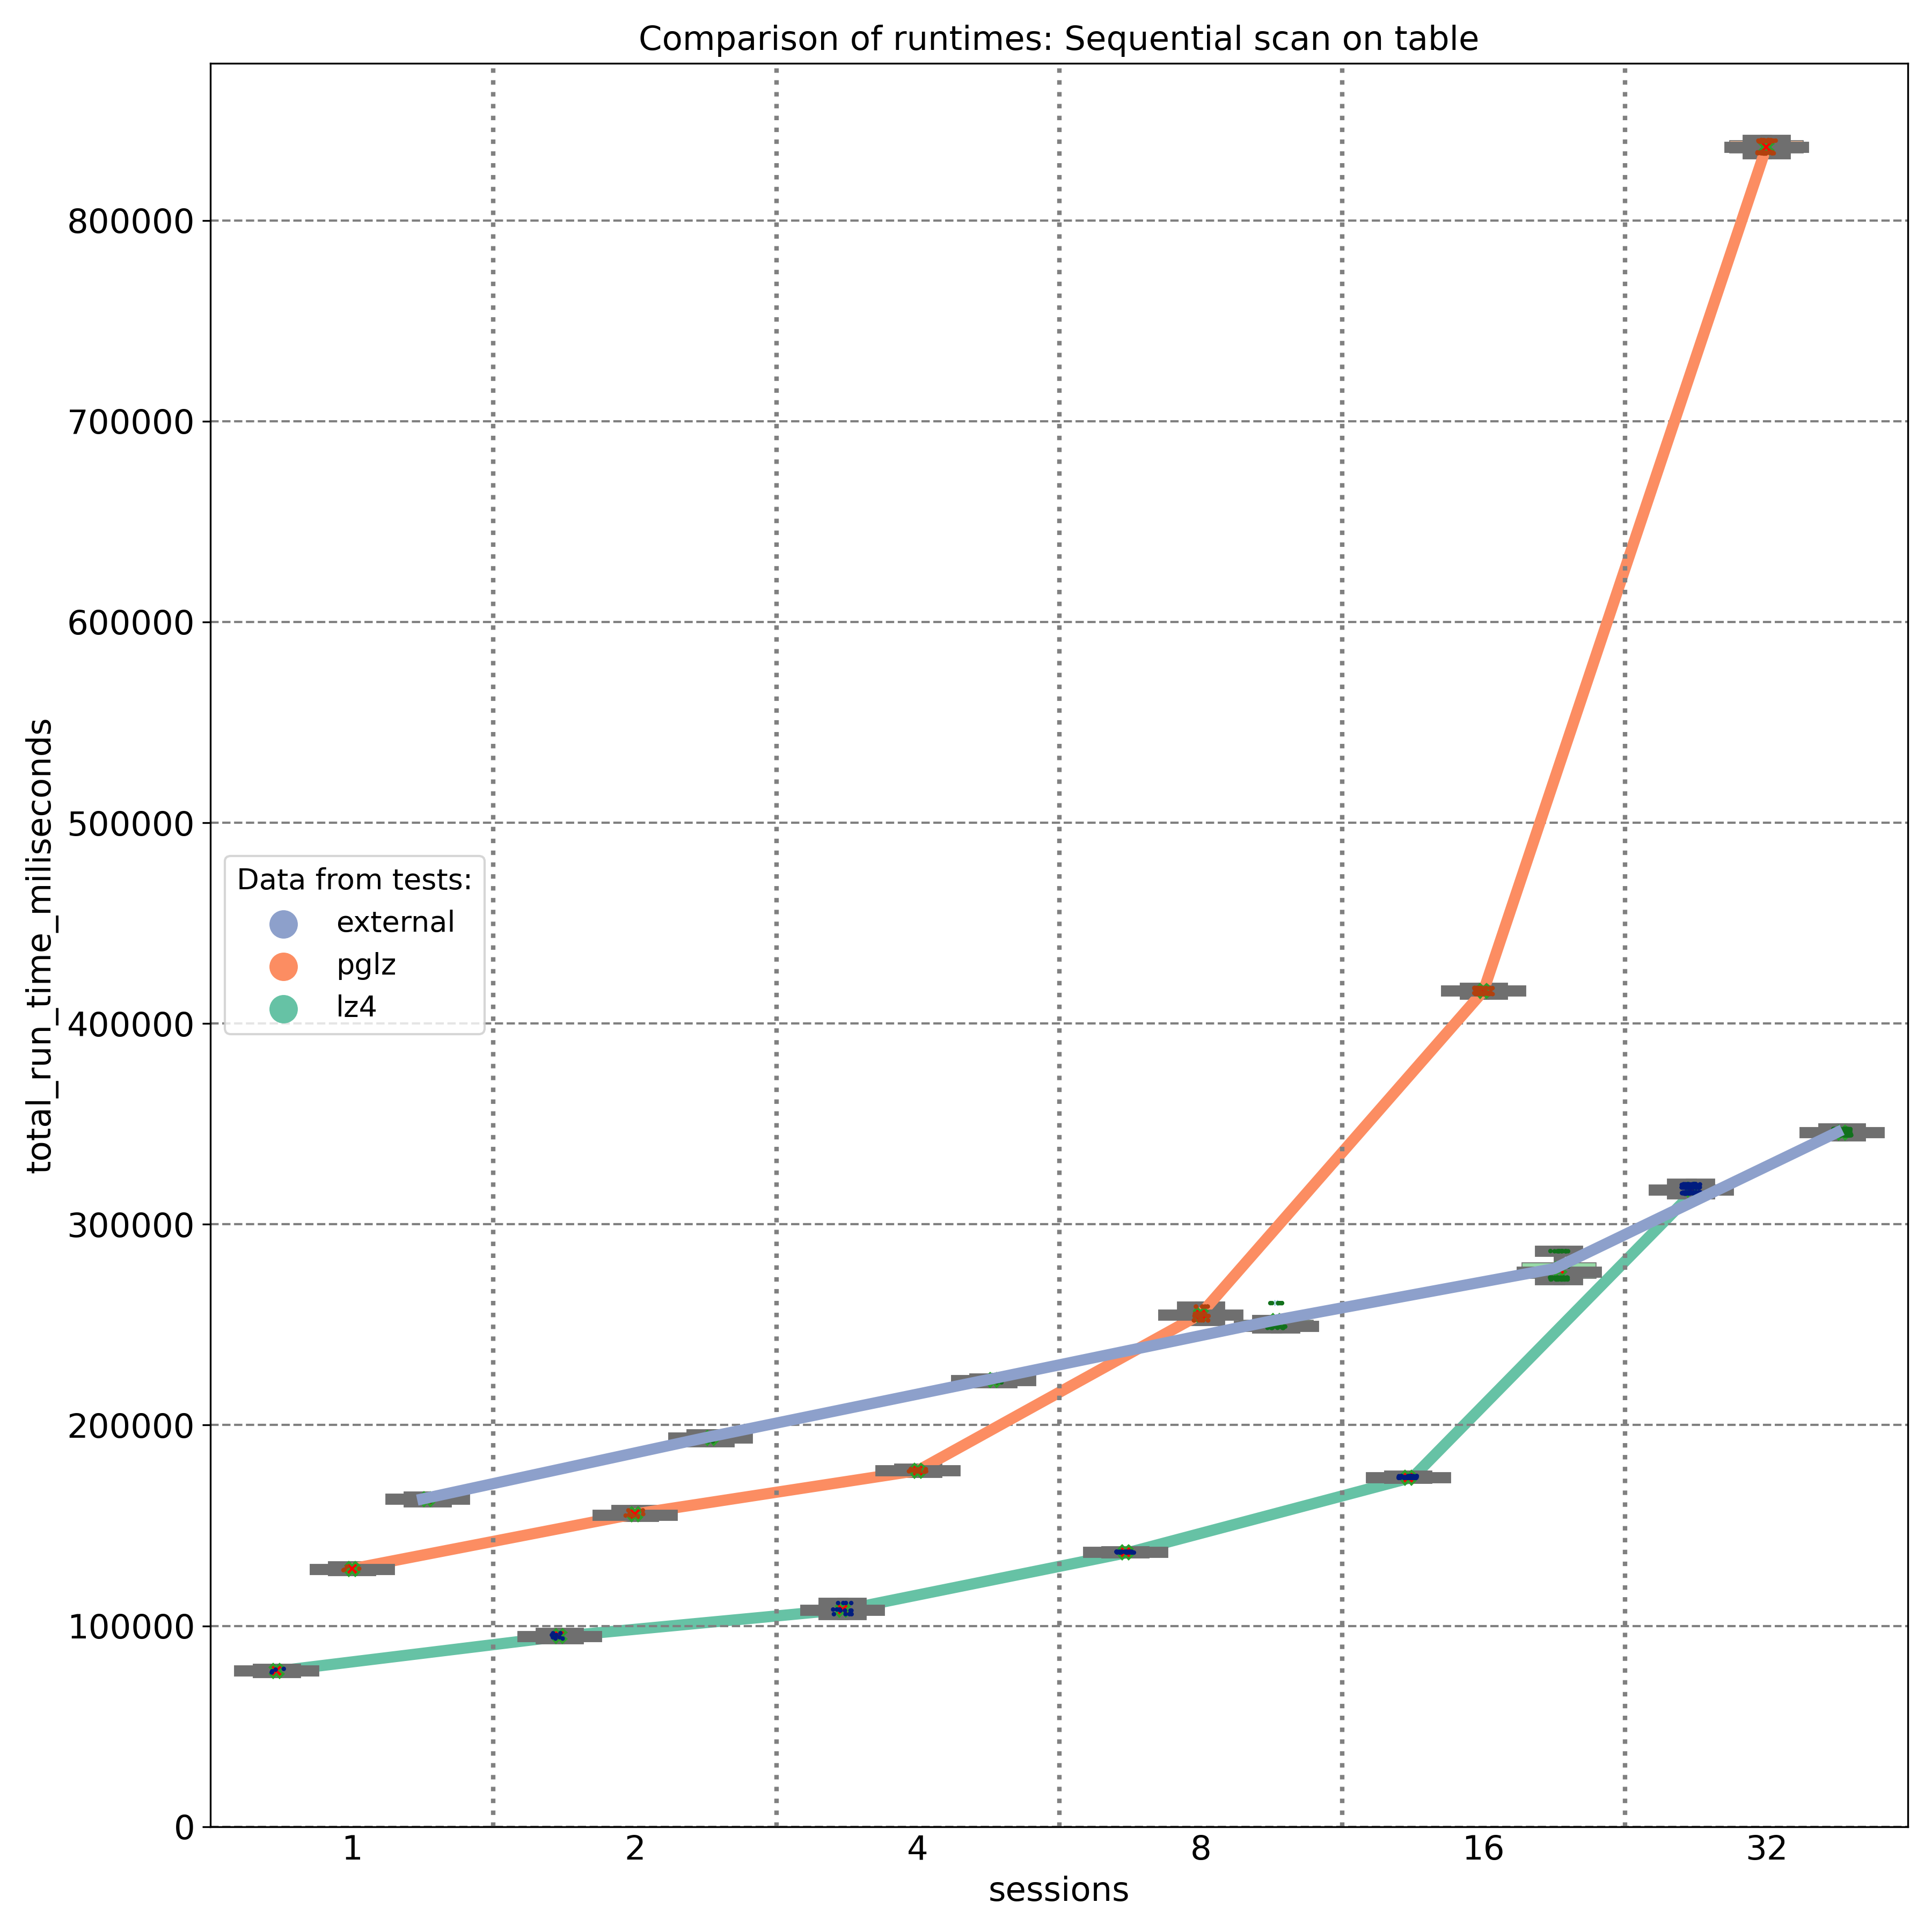
The second test targeted JSONB keys stored at different positions (beginning, middle, and end) within the JSONB binary object. The results, measured on a 20-core machine, demonstrate that PGLZ (red line) is slower than the uncompressed table right from the start. In this case, the performance of PGLZ degrades linearly, rather than geometrically, but still lags significantly behind LZ4 (green line). LZ4 consistently outperformed uncompressed data throughout the test.
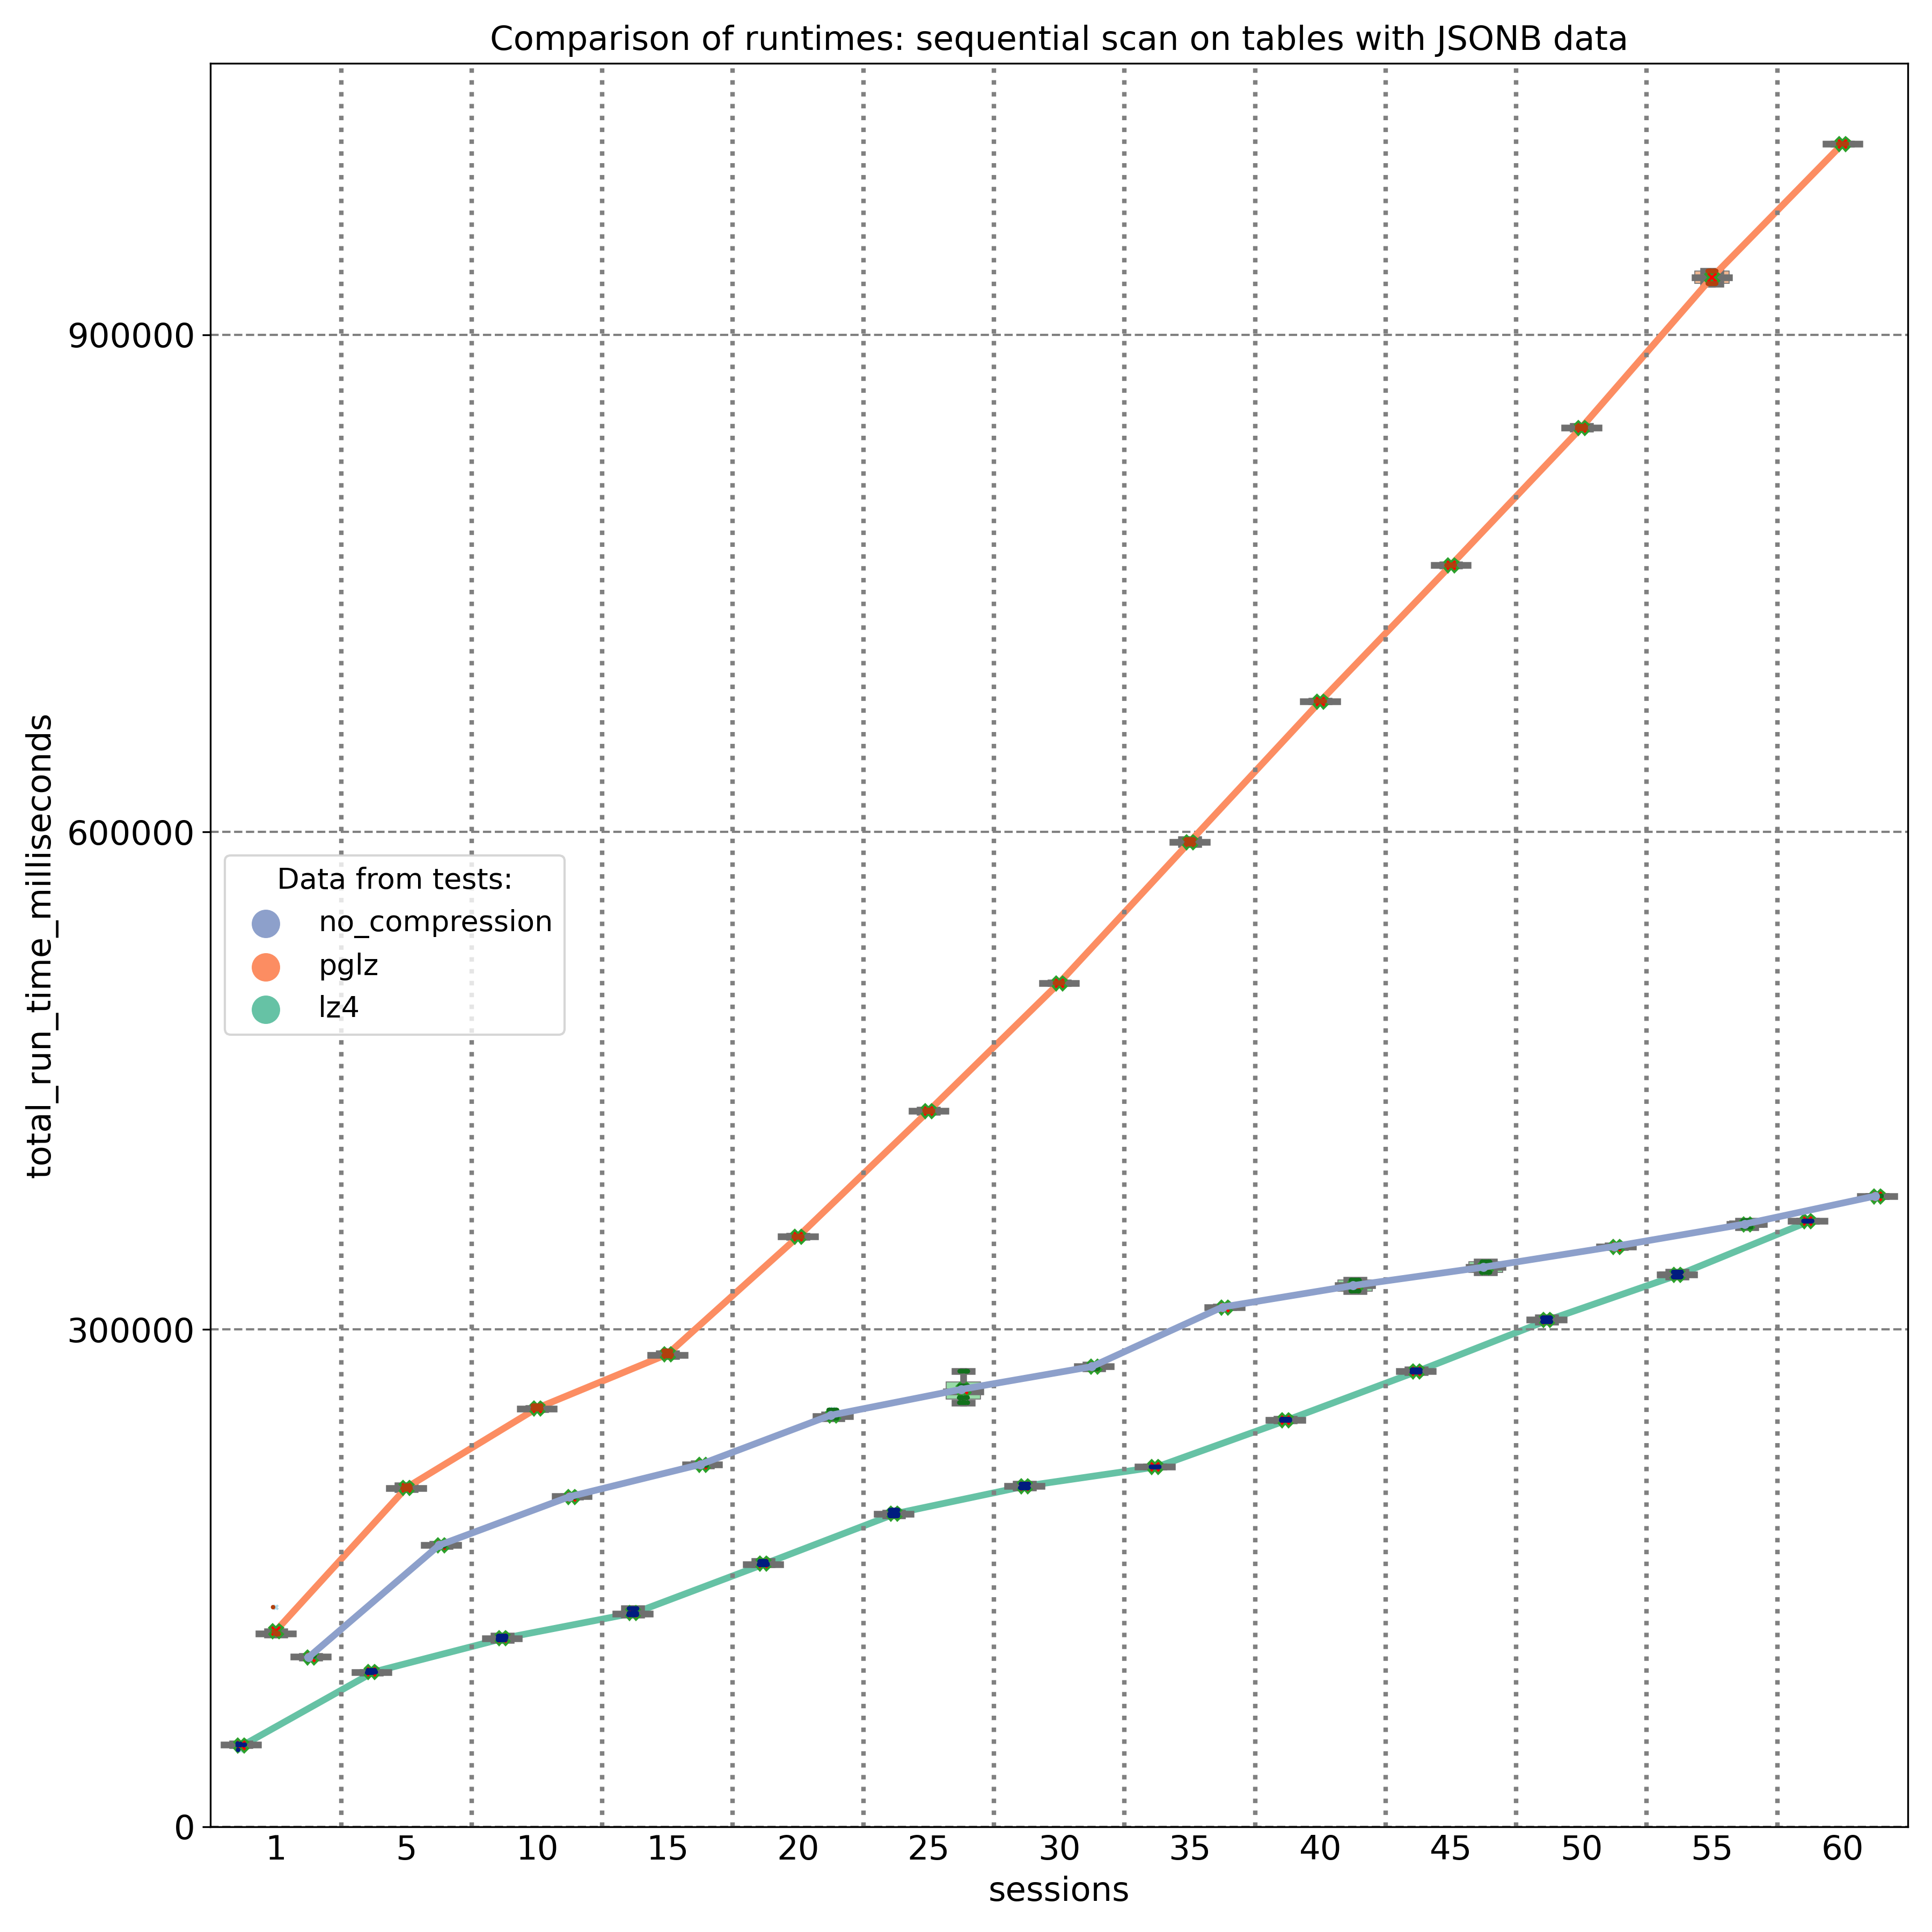
But if we decide to change the compression algorithm, simply creating a new table with the default_toast_compression setting set to “lz4” and running INSERT INTO my_table_lz4 SELECT \* FROM my_table_pglz; will not change the compression algorithm of existing records. Each already compressed record retains its original compression algorithm. You can use the pg_column_compression system function to check which algorithm was used for each record. The default compression setting only applies to new, uncompressed data; old, already compressed data is copied as-is.
To truly convert old data to a different compression algorithm, we need to recast it through text. For JSONB data, we would use a query like: INSERT INTO my_table_lz4 (jsonb_data, …) SELECT jsonb_data::text::jsonb, … FROM my_table_pglz; This ensures that old data is stored using the new LZ4 compression. However, this process can be time and resource-intensive, so it’s important to weigh the benefits before undertaking it.
To summarize it – my tests showed significant performance differences between the PGLZ and LZ4 algorithms for storing compressed JSONB data. These differences are particularly pronounced when the machine is under high parallel load. The tests showed a strong degradation in performance on data stored with PGLZ algorithm, when the number of parallel sessions exceeded the number of available cores. In some cases, PGLZ performed worse than uncompressed data right from the start. In contrast, LZ4 consistently outperformed both uncompressed and PGLZ-compressed data, especially under heavy loads. Setting LZ4 as the default compression for new data seems to be the right choice, and some cloud providers have already adopted this approach. However, these results should not be applied blindly to existing data. You should test your specific use cases and data to determine if conversion is worth the time and resource investment, as converting data requires re-casting and can be a resource-intensive process.