Many companies these days are thinking about migrating their databases from legacy or proprietary system to PostgreSQL. The primary aim is to reduce costs, enhance capabilities, and ensure long-term sustainability. However, even just the idea of migrating to PostgreSQL can be overwhelming. Very often, knowledge about the legacy applications is limited or even lost. In some cases, vendor support is diminishing, and expert pools and community support are shrinking. Legacy databases are also often running on outdated hardware and old operating systems, posing further risks and limitations. (more…)
PGConf.DE 2025, the 9th Annual PostgreSQL Conference Germany, was held on May 8–9, 2025, at the Marriott Hotel near Potsdamer Platz in Berlin. The event interconnected PostgreSQL enthusiasts, developers, DBAs, and industry sponsors for two days of fascinating talks across four parallel tracks. It was the biggest event so far, with 347 attendees. The whole conference was very well organized, and therefore special thanks are due to all the organizers—in particular Andreas Scherbaum, the main organizer—for their efforts and hard work.
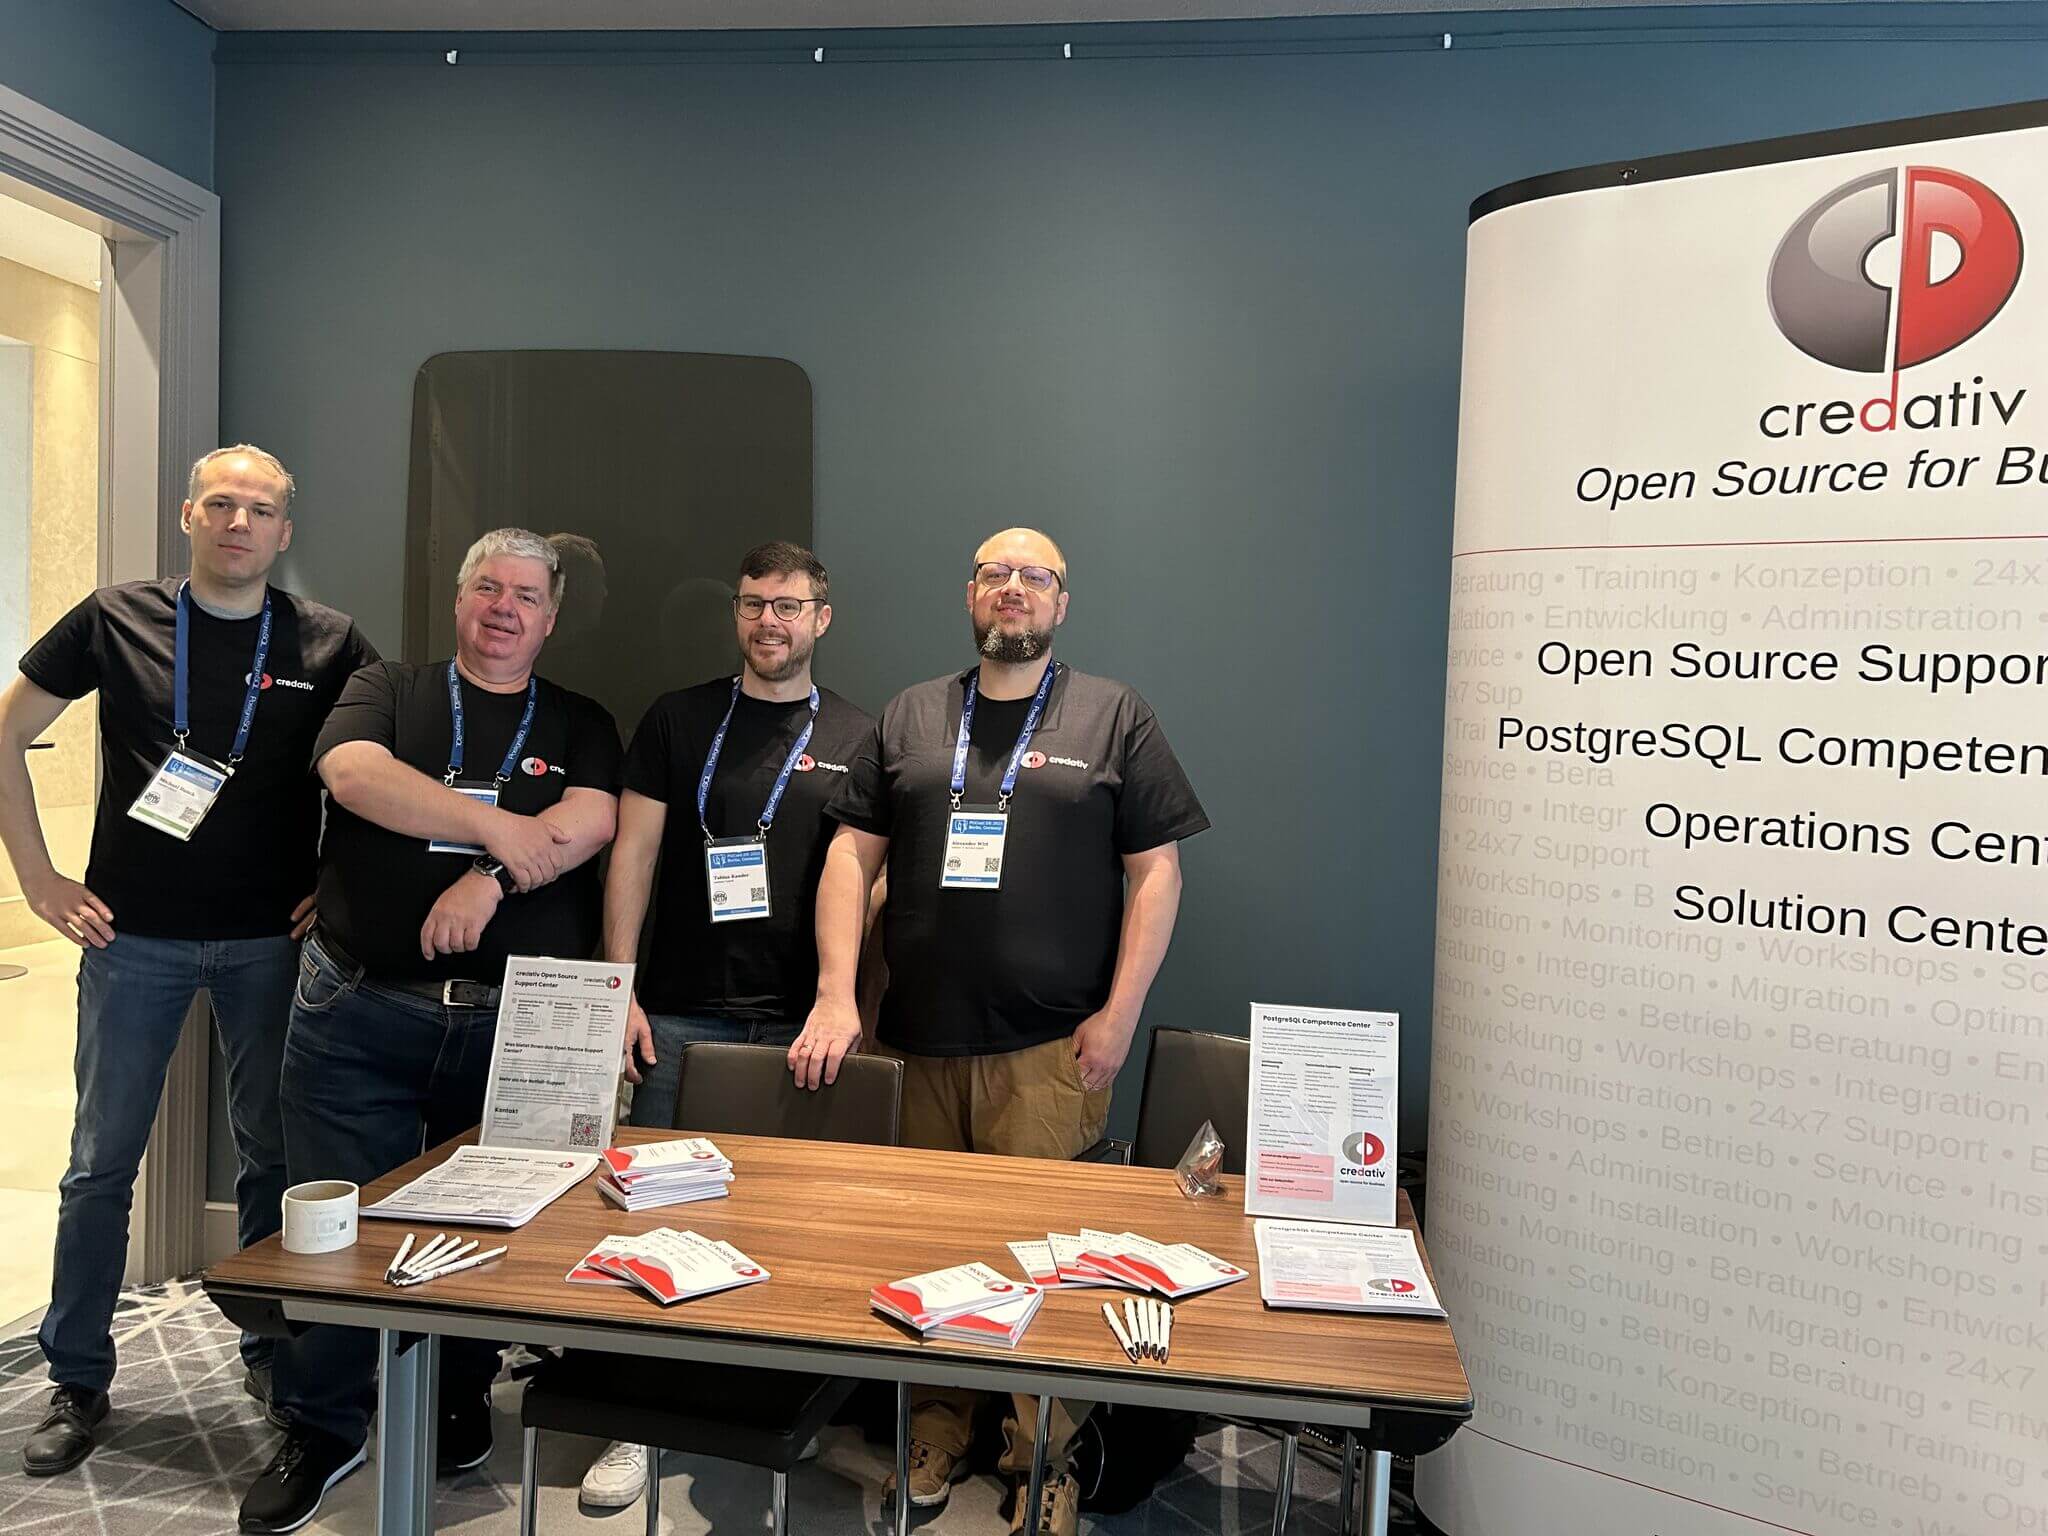
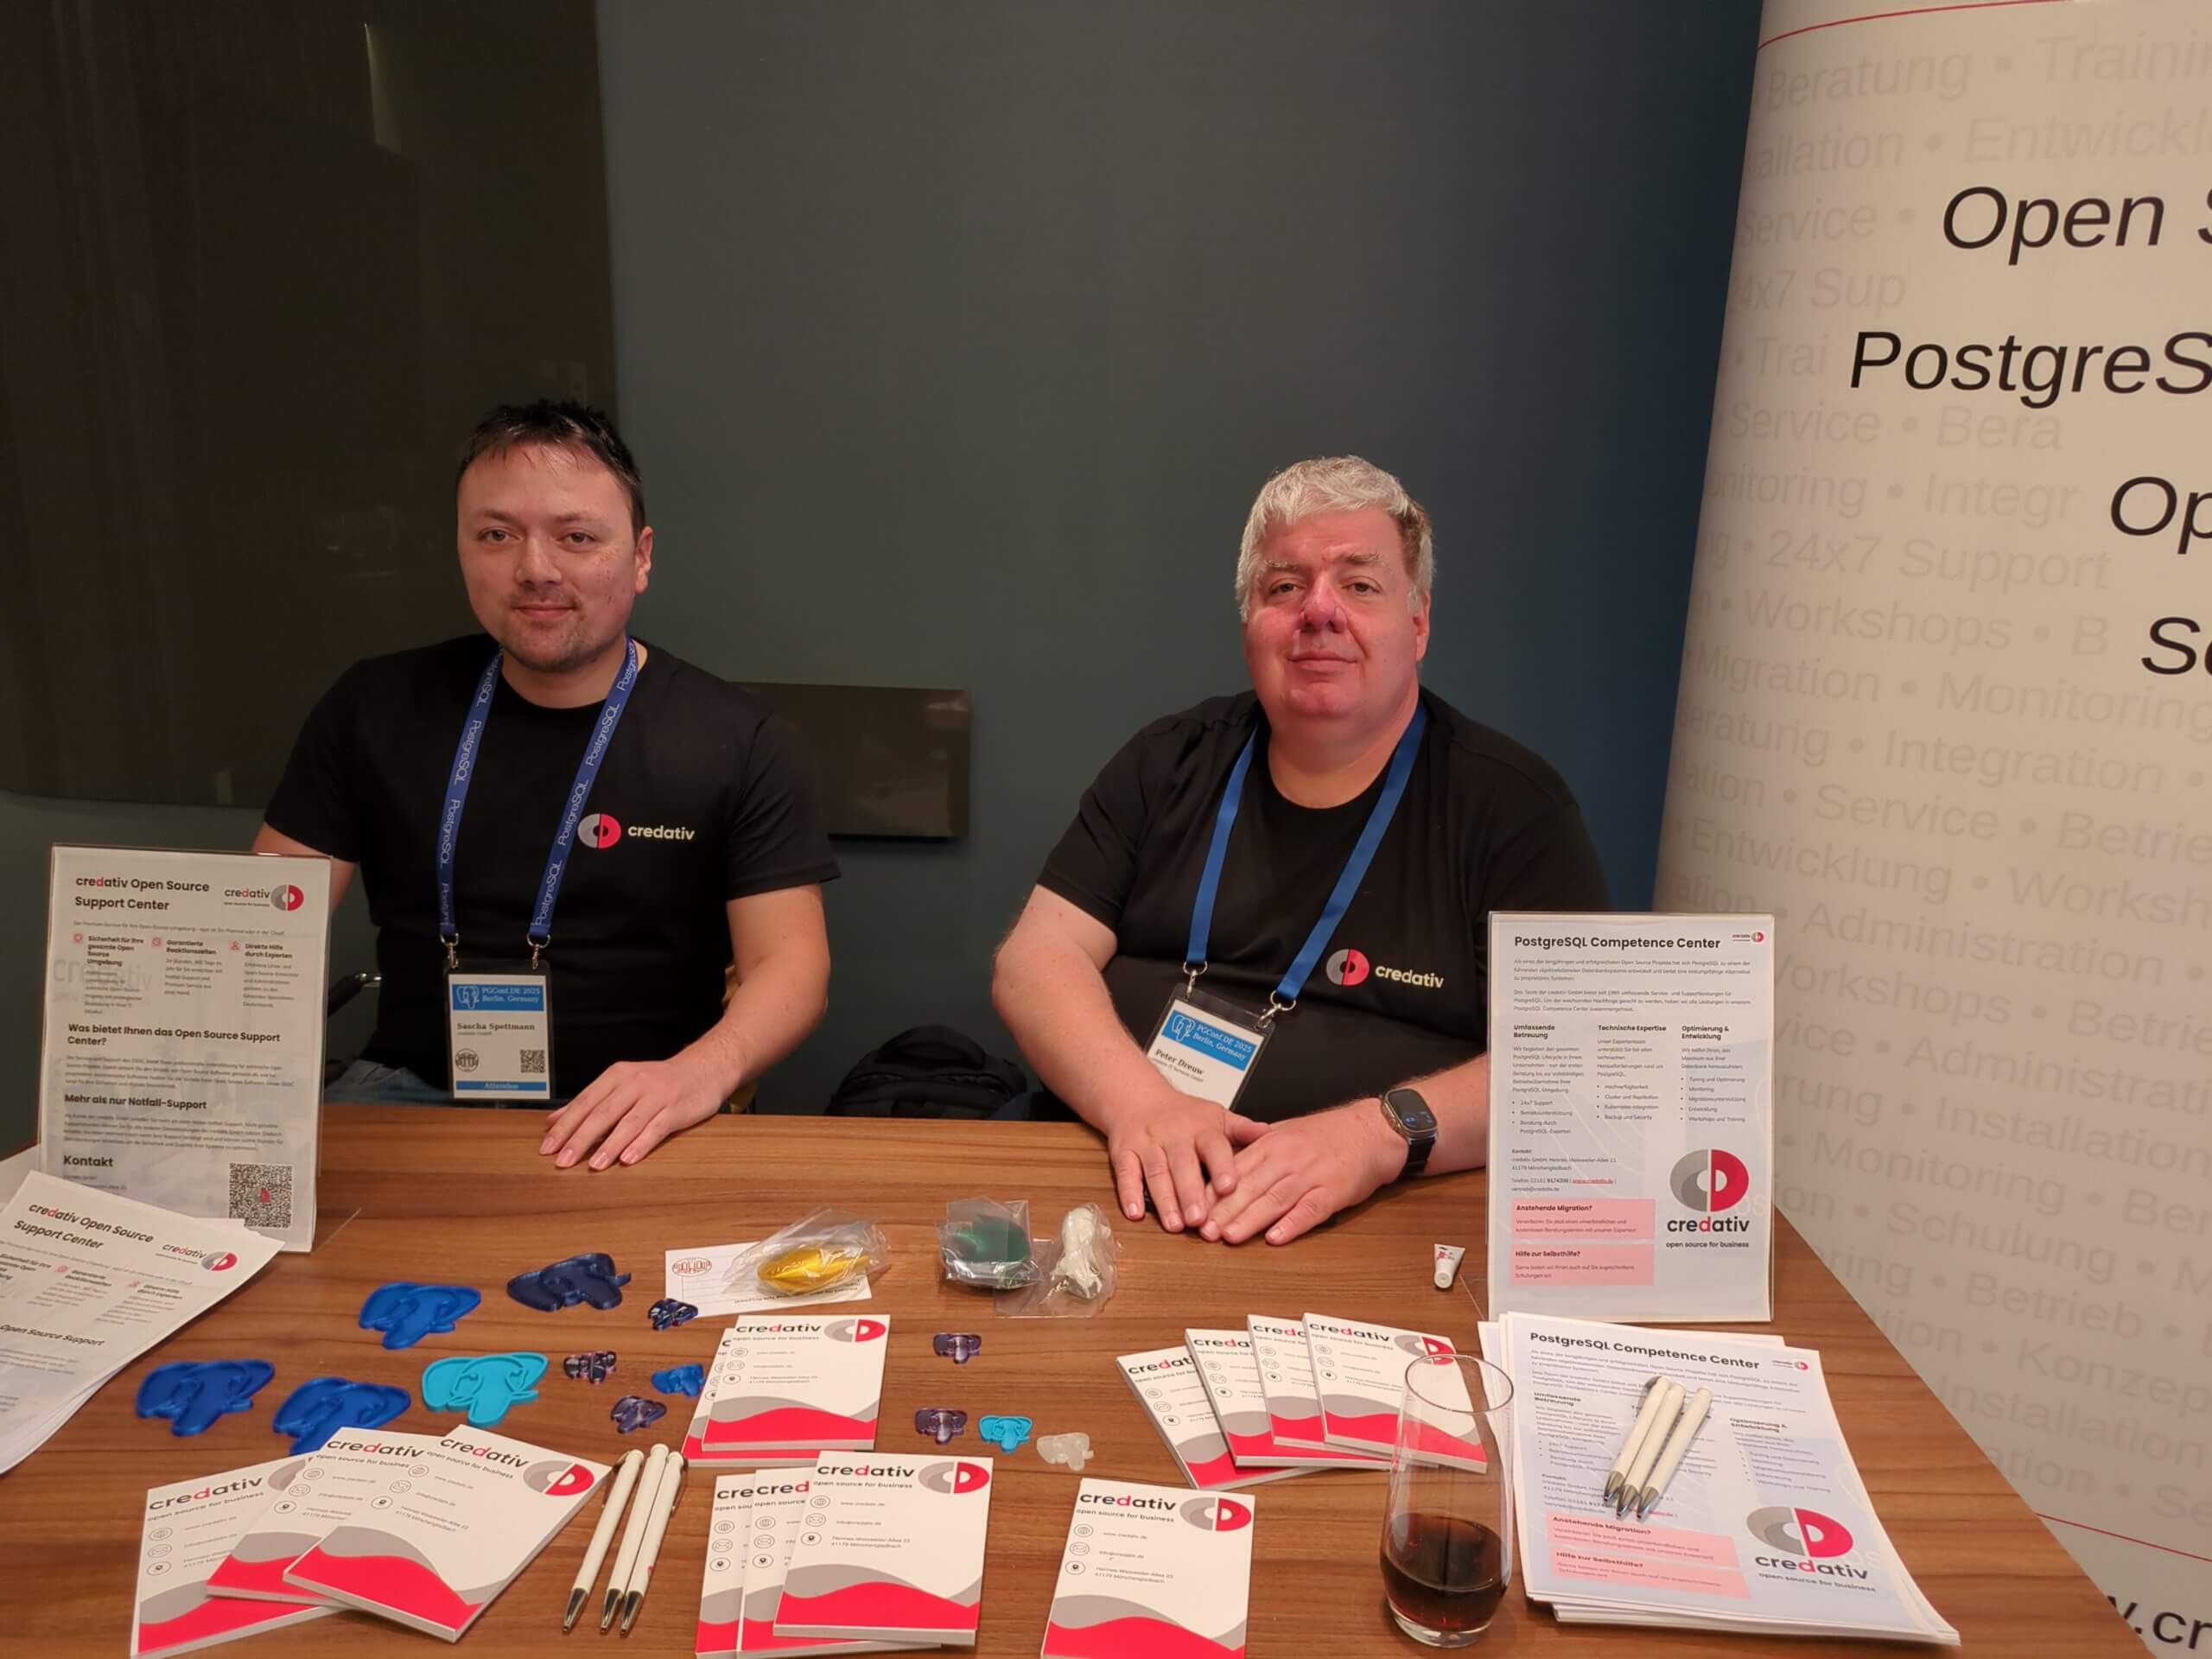
Our company, credativ GmbH, being independent again, participated as a gold sponsor. The credativ CTO Alexander Wirt, Head of Sales & Marketing Peter Dreuw and team leader of Database team Tobias Kauder, were available for attendees at the credativ booth. Many thanks to our team colleague Sascha Spettmann for delivering all the stands and billboards to the conference and back again.

In total, we held four talks at the conference. Michael Banck, technical leader of our database team, presented the German-language talk “PostgreSQL Performance Tuning.” He provided a deep and comprehensive overview of the most important performance-tuning parameters in PostgreSQL and explained how they influence the database’s behavior. His talk attracted a large audience and was very well received.

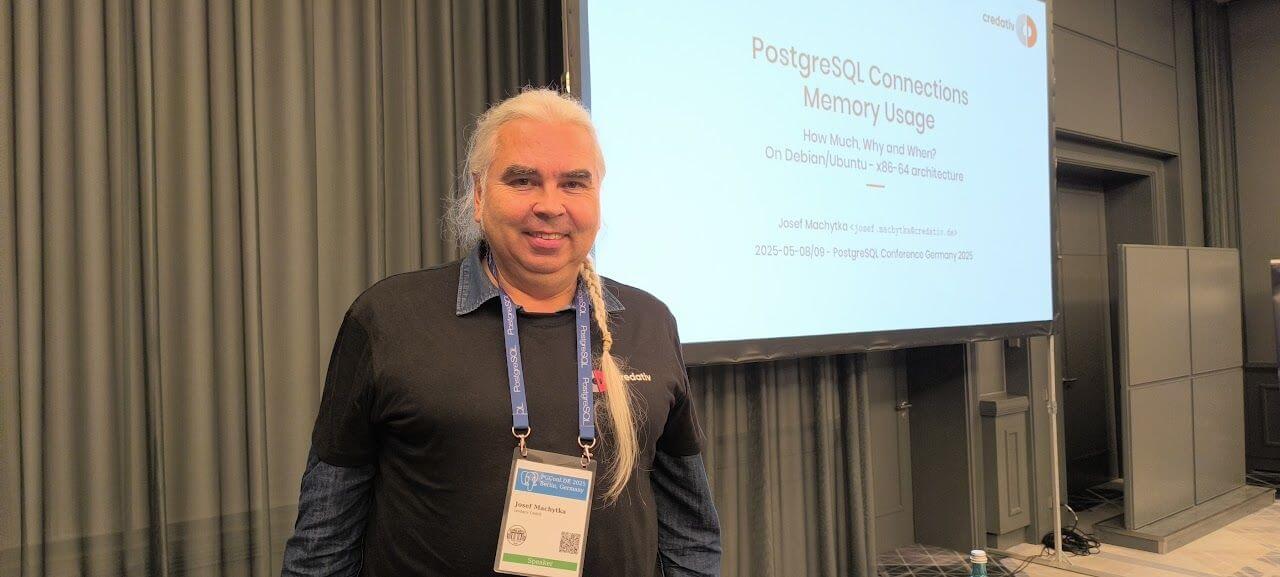
I had an absolutely unique opportunity to present three different talks in the English track. In my regular talk “PostgreSQL Connections Memory Usage: How Much, Why and When,” I presented the results of my research and tests on PostgreSQL connections’ memory usage. After explaining the most important aspects of Linux memory management and measurements of memory usage reported by standard commands, I detailed PostgreSQL connection memory usage during query execution based on numbers reported in smaps files. I intend to publish detailed blog posts about my findings soon. My other talk, “Building a Data Lakehouse with PostgreSQL,” was originally chosen as a reserve talk in case of a last-minute cancellation. Unfortunately, this indeed happened: the talk “Creating a Board Game Chatbot with Postgres, AI, and RAG” by Matt Cornillon had to be replaced. The speaker could not attend because his flight was unexpectedly canceled at very short notice.
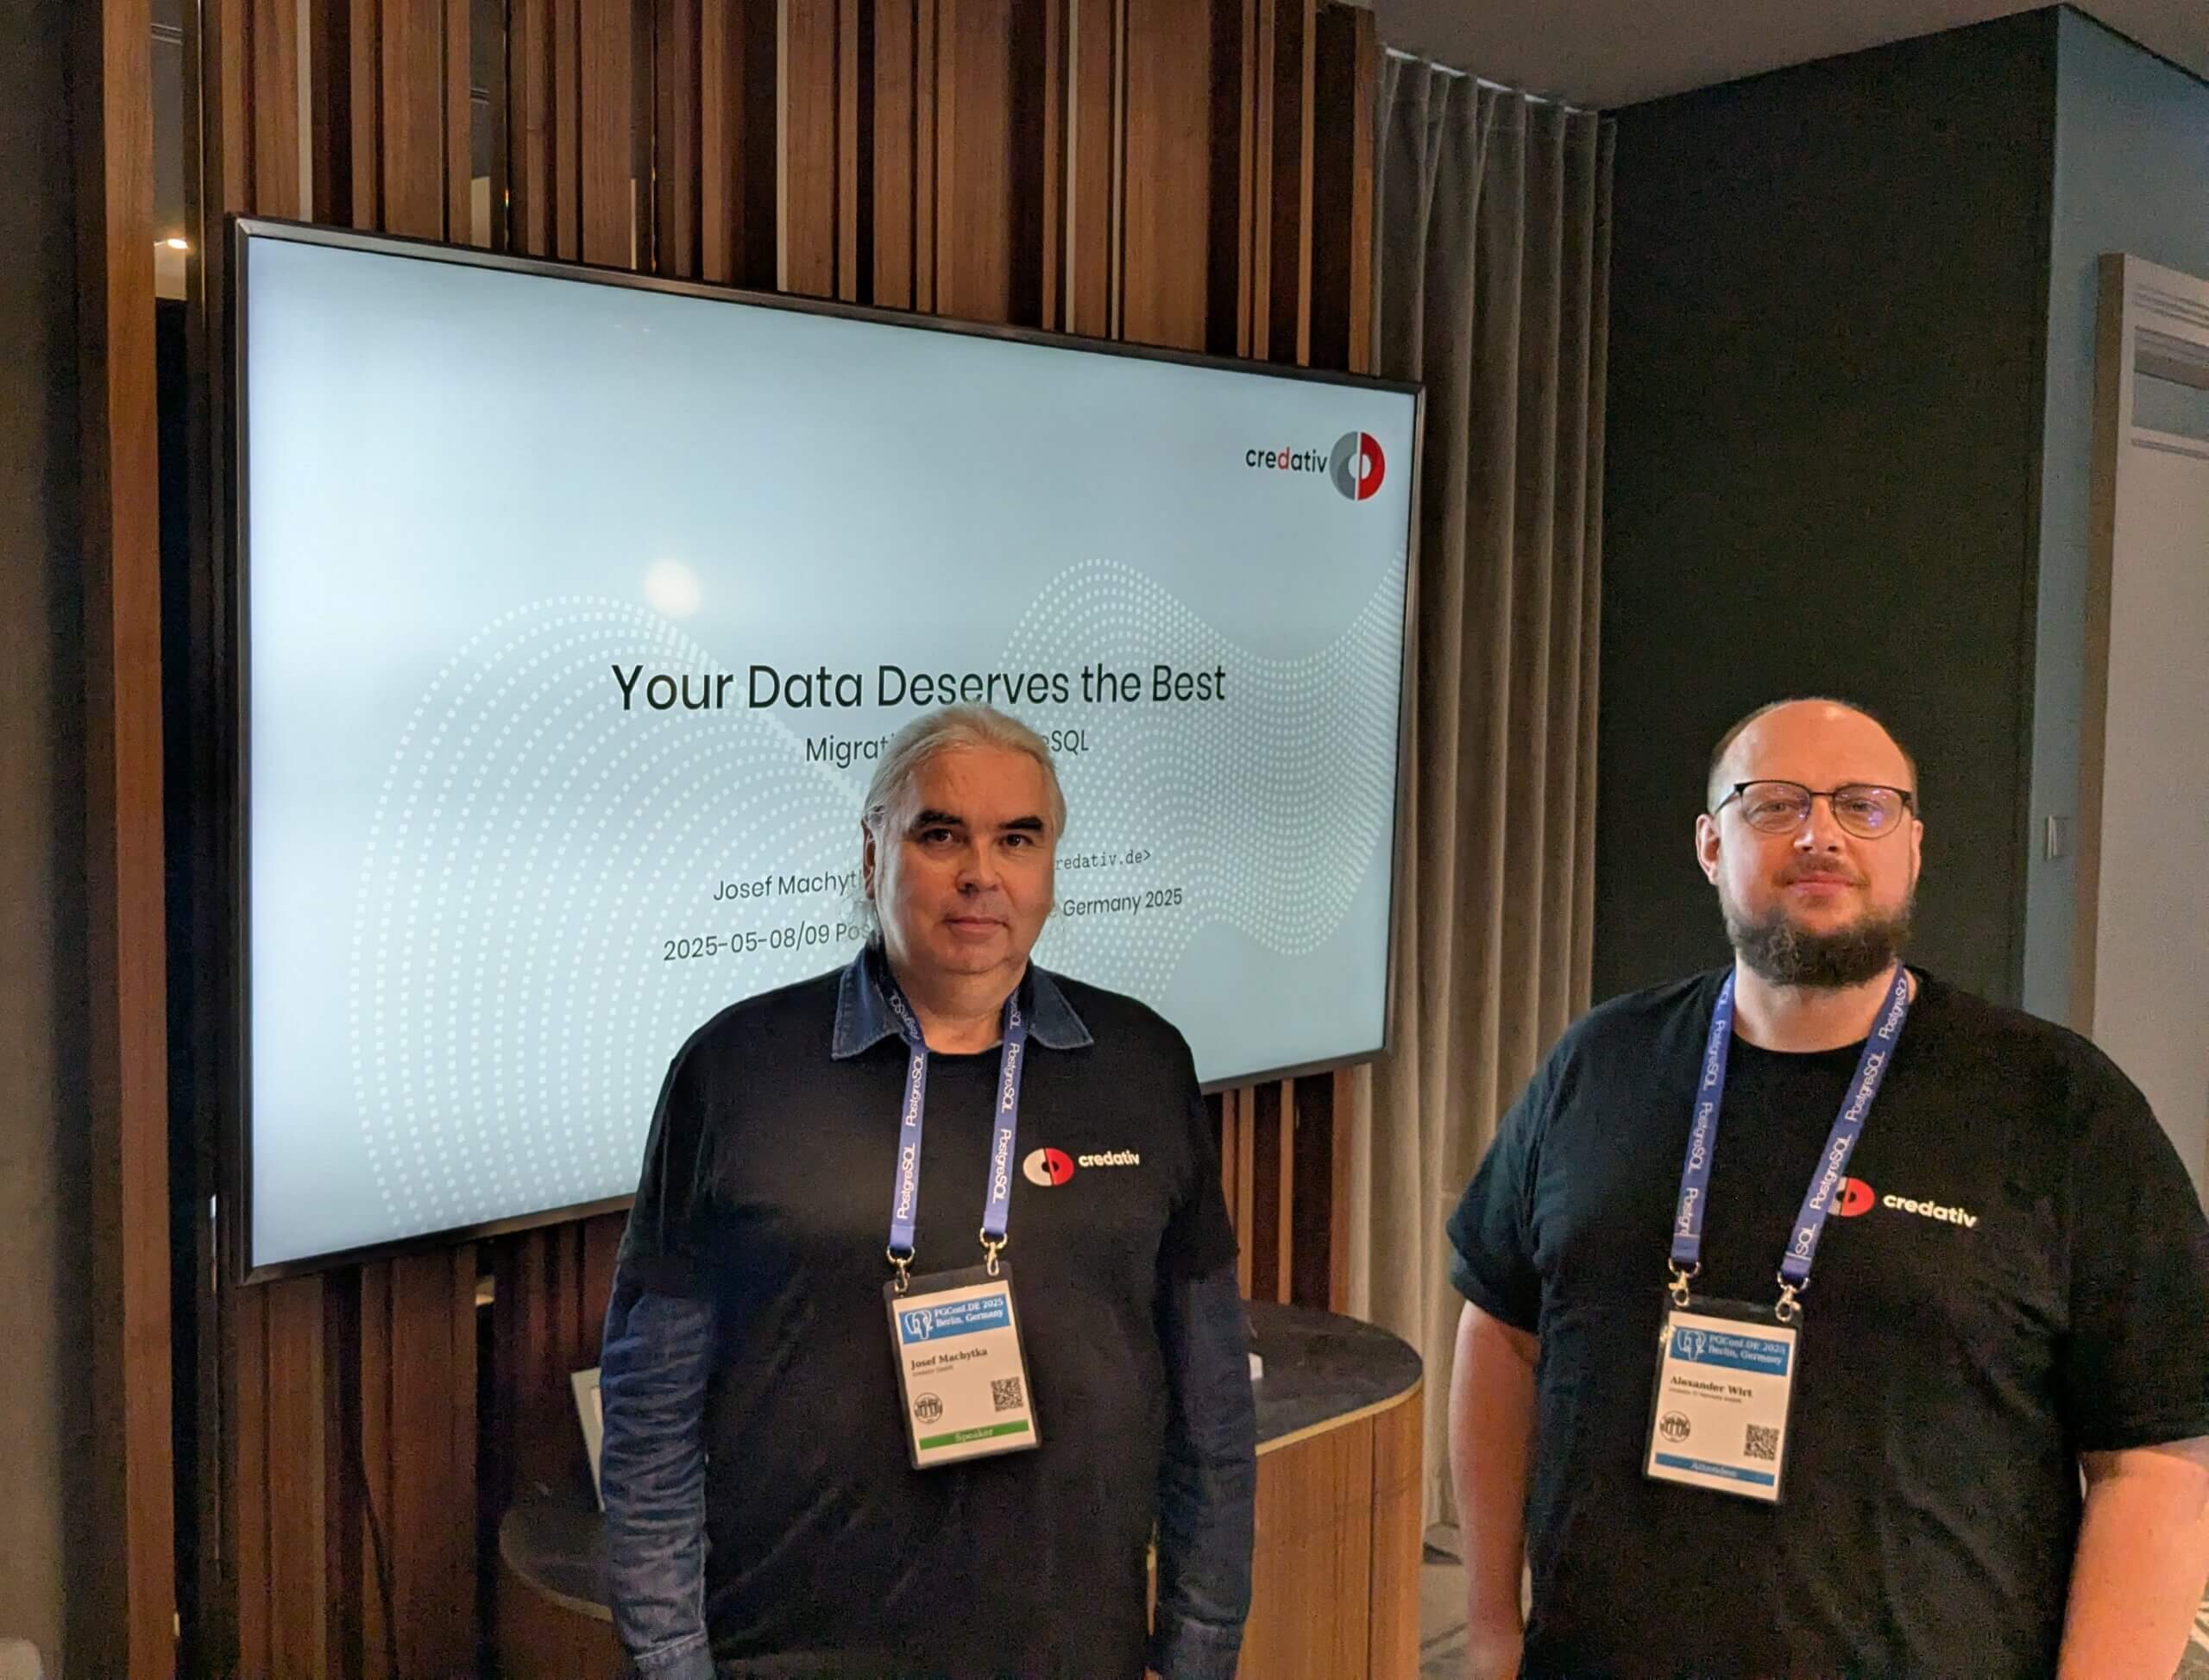
In the sponsor track, credativ CTO Alexander Wirt and I presented a talk titled “Your Data Deserves the Best: Migration to PostgreSQL.” It featured our new migration tool, “credativ-pg-migrator.” It is capable of migrating data models (tables, data, indexes, constraints, and views) from Informix, IBM DB2 LUW, MS SQL Server, Sybase ASE, SQL Anywhere, and MySQL/MariaDB. In the case of Informix, it can also convert stored procedures, functions, and triggers into PostgreSQL PL/pgSQL. We will share more details about this tool in a separate blog post.
Since there were always three or four parallel talks, I had to carefully choose which sessions to attend. I greatly enjoyed the talk “András in Windowsland – a DBA’s (mis)adventures” by András Váczi from Cybertec. The speaker presented many useful tips for accessing and troubleshooting PostgreSQL on Windows. I also enjoyed the German talk “Modern VACUUM,” delivered by Christoph Berg from Cybertec. He provided valuable insights into the history and implementation details of the VACUUM command and autovacuum background processes. Another very interesting talk was the German presentation “Modernes SSL ideal einsetzen” by Peter Eisentraut from EDB. The talk covered selecting appropriate protocol versions and cryptographic cipher suites, managing keys and certificates, and configuring client/server settings to meet contemporary security standards. The talk “Comparing the Oracle and PostgreSQL transaction systems,” delivered by Laurenz Albe from Cybertec, received a lot of well-deserved attention. Key topics included Oracle’s undo/redo mechanism versus PostgreSQL’s MVCC approach, differences in isolation level defaults and anomalies, and how each database implements constraints and transactional DDL. Last but not least, I want to mention the talk “What is an SLRU anyway?” delivered by major PostgreSQL contributor Álvaro Herrera. He explained that SLRUs are essentially circular logs with an in-memory cache used for tracking information such as committed transactions or snapshot data and he highlighted the significance of PostgreSQL 17’s innovations which made SLRU cache sizes configurable. Unfortunately, the talks were not recorded, but slides for the majority of the talks are already available on the conference website.
The whole event was highly informative and provided excellent networking opportunities. We are very much looking forward to participating in the next PGConf.DE. In the meantime, stay tuned to all credativ news, follow us on social media – LinkedIn and Mastodon.
If you are interested in our PostgreSQL related services, click here!
The Prague PostgreSQL Developer Day (P2D2) is a well-established Czech PostgreSQL conference. This year’s 17th edition was exceptional, with 275 registered visitors and 16 talks across two tracks. Notably, several major PostgreSQL contributors and core members were present, underlining the event’s significance. Tomas Vondra, as in previous years, organized the conference. Bruce Momjian, Vice President and Postgres Evangelist at EDB, led a half-day workshop titled “Postgres & AI: From the Trenches to the Sky.” Robert Haas delivered a really interesting talk on Incremental Backup in PostgreSQL 17, a feature he developed.
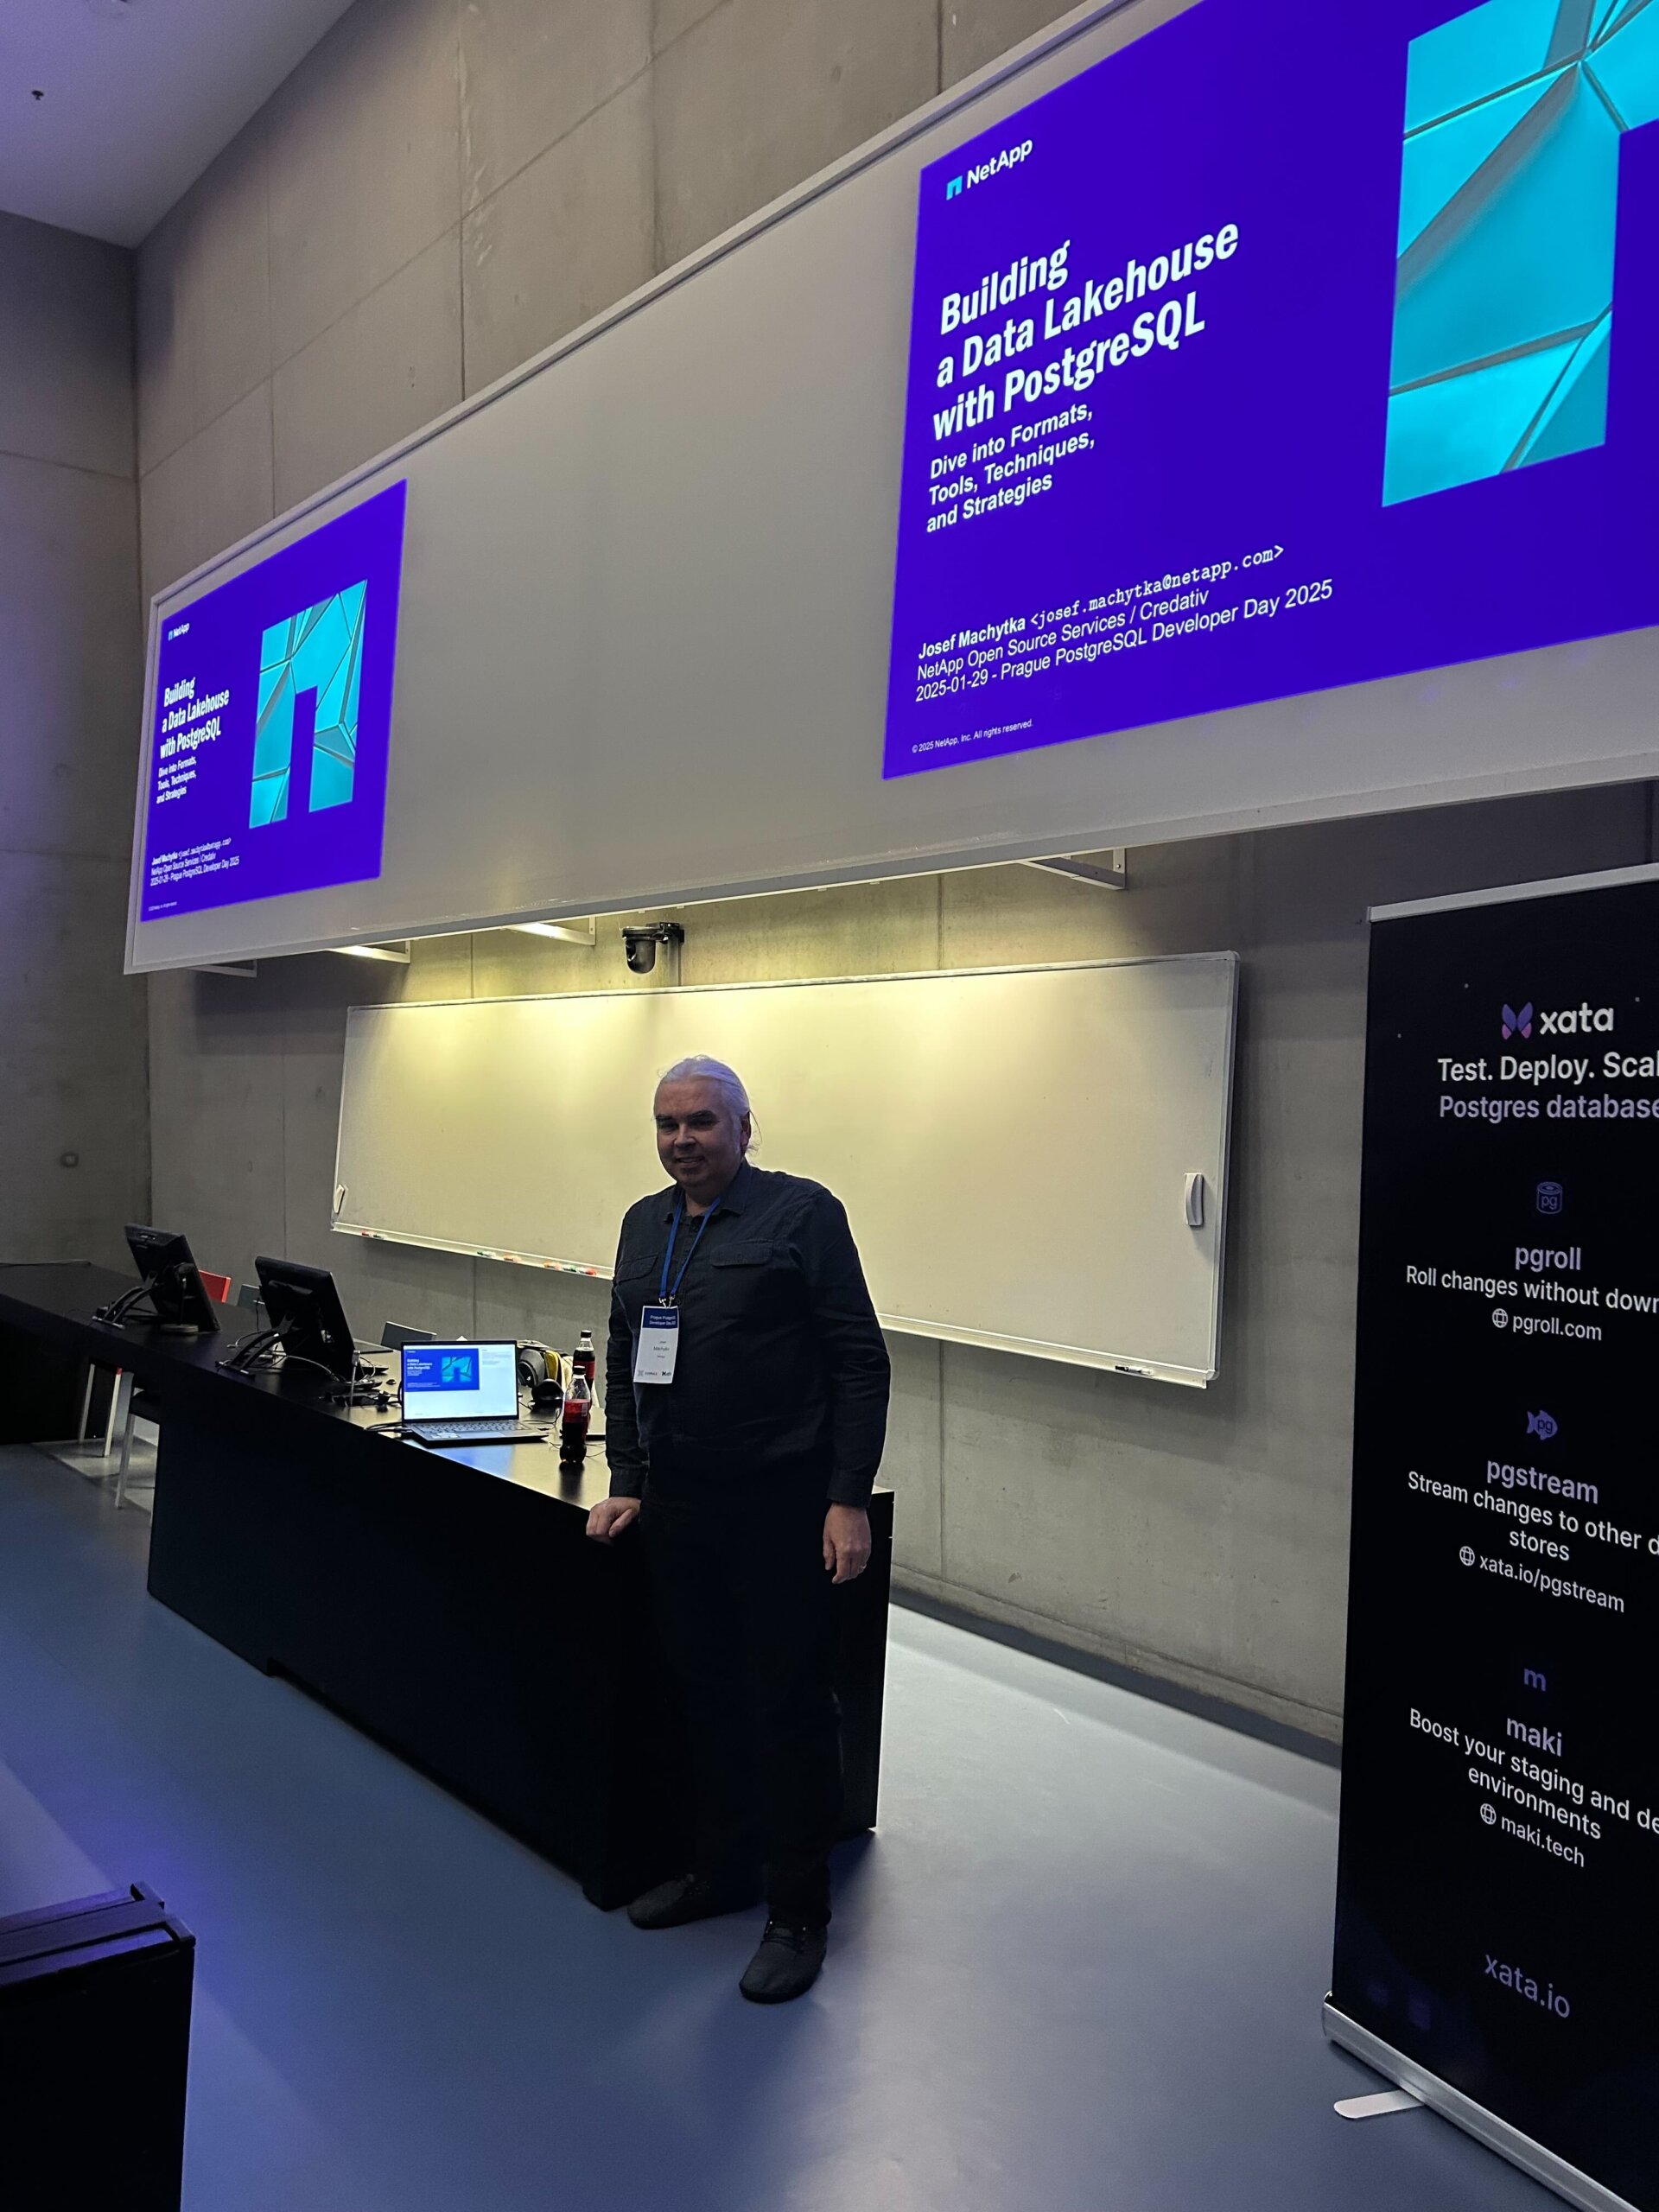
I had the fantastic opportunity to contribute to this conference with my new talk, “Building a Data Lakehouse with PostgreSQL: Dive into Formats, Tools, Techniques, and Strategies.” Given the still evolving nature of this topic and the varying definitions of data lakehouses, I covered the most important areas, highlighting the functionalities and extensions PostgreSQL offers. I received very positive feedback on my talk and had several insightful discussions about the topic with different people.
Among the talks I attended, I particularly enjoyed Robert Haas’s presentation on Incremental Backups, the practical demonstration of PostgreSQL statistics in the talk “Statistics: How PostgreSQL Counts Without Counting” by Sadeq Dousti, and the very interesting presentation “Anatomy of Table-Level Locks in PostgreSQL” by Gülçin Yıldırım Jelínek. She explained in detail the hierarchy of different locking levels and the events leading to delays in operations due to locks. Other notable talks included “Replicating Schema Changes with PostgreSQL” by Esther Miñano and “When Autovacuum Met FinOps: A Cloud Romance” by Mayuresh Bagayatkar. You can find summaries of all talks and soon also the slides on the P2D2 website. I want to express my gratitude to all the organizers of this amazing event, especially Tomas Vondra and Gülçin Yıldırım Jelínek, who both do a great job in organizing PostgreSQL events not only in the Czech Republic.


(c) Tomas Vondra EDB & organizers of P2D2 conference
Version 17 of PostgreSQL has been released for a while. One of the many features is a change by Tom Lane called “Rearrange pg_dump’s handling of large objects for better efficiency”. In the past, we have seen our customers have several problems with a large number of large objects being a performance issue for dump/restore. The main reason for this is that large objects are quite unlike to TOAST (The Oversized Attribute Storage Technique): while TOASTed data is completely transparent to the user, large objects are stored out-of-line in a pg_largeboject table with a link to the particular row in that table being an OID in the table itself.
Introduction To Large
Objects
Here is an example on how large objects can be used:
postgres=# CREATE TABLE test(id BIGINT, blob OID);
CREATE TABLE
postgres=# INSERT INTO test VALUES (1, lo_import('/etc/issue.net'));
INSERT 0 1
postgres=# SELECT * FROM test;
 id | blob
----+-------
  1 | 33280
(1 row)

postgres=# SELECT * FROM pg_largeobject;
 loid  | pageno |                    data
-------+--------+--------------------------------------------
 33280 |      0 | \x44656269616e20474e552f4c696e75782031320a
(1 row)

postgres=# SELECT lo_export(test.blob, '/tmp/foo') FROM test;
 lo_export
-----------
         1
(1 row)

postgres=# SELECT pg_read_file('/tmp/foo');
    pg_read_file
---------------------
 Debian GNU/Linux 12+

(1 row)

postgres=# INSERT INTO test VALUES (1, lo_import('/etc/issue.net'));
INSERT 0 1
Now if we dump the database in custom format with both version 16 and 17 of pg_dump and then use pg_restore -l to display the table of contents (TOC), we see a difference:
$ for version in 16 17; do /usr/lib/postgresql/$version/bin/pg_dump -Fc -f lo_test_$version.dmp; \
> pg_restore -l lo_test_$version.dmp | grep -v ^\; > lo_test_$version.toc; done
$ diff -u lo_test_{16,17}.toc
--- lo_test_16.toc  2024-12-11 09:05:46.550667808 +0100
+++ lo_test_17.toc  2024-12-11 09:05:46.594670235 +0100
@@ -1,5 +1,4 @@
 215; 1259 33277 TABLE public test postgres
-3348; 2613 33280 BLOB - 33280 postgres
-3349; 2613 33281 BLOB - 33281 postgres
+3348; 2613 33280 BLOB METADATA - 33280..33281 postgres
 3347; 0 33277 TABLE DATA public test postgres
-3350; 0 0 BLOBS - BLOBS
+3349; 0 0 BLOBS - 33280..33281 postgres
The dump with version 17 combines the large object metadata into BLOB METADATA, creating only one entry in the TOC for them.
Further, if we use the directory dump format, we see that pg_dump creates a file for each large object:
$ pg_dump -Fd -f lo_test.dir
$ ls lo_test.dir/
3347.dat.gz  blob_33280.dat.gz  blob_33281.dat.gz  blobs.toc  toc.dat
If there are only a few large objects, this is not a problem. But if the large object mechanism is used to create hundreds of thousands or millions of large objects, this will become a serious problem for pg_dump/pg_restore.
Finally, in order to fully remove the large objects, it does not suffice to drop the table, the large object needs to be unlinked as well:
postgres=# DROP TABLE test;
DROP TABLE
postgres=# SELECT COUNT(*) FROM pg_largeobject;
 count
-------
     2
(1 row)

postgres=# SELECT lo_unlink(loid) FROM pg_largeobject;
 lo_unlink
-----------
         1
         1
(2 rows)

postgres=# SELECT COUNT(*) FROM pg_largeobject;
 count
-------
     0
(1 row)
Benchmark
We generate one million large objects in a PostgreSQL 16 instance:
lotest=# SELECT lo_create(id) FROM generate_series(1,1000000) AS id;
 lo_create
-----------
         1
         2
[...]
    999999
   1000000
(1000000 rows)

lotest=# SELECT COUNT(*) FROM pg_largeobject_metadata;
  count
---------
 1000000
(1 row)
(1 row)
We now dump the database with pg_dump from both version 16 and 17, first as a custom and then as a directory dump, using the time utility to track runtime and memory usage:
$ for version in 16 17; do echo -n "$version: "; \
> /usr/bin/time -f '%E %Mk mem' /usr/lib/postgresql/$version/bin/pg_dump \
> -Fc -f lo_test_$version.dmp lotest; done
16: 0:36.73 755692k mem
17: 0:34.69 217776k mem
$ for version in 16 17; do echo -n "$version: "; \
> /usr/bin/time -f '%E %Mk mem' /usr/lib/postgresql/$version/bin/pg_dump \
> -Fd -f lo_test_$version.dir lotest; done
16: 8:23.48 755624k mem
17: 7:51.04 217980k mem
Dumping using the directory format takes much longer than with the custom format, while the amount of memory is very similar for both. The runtime is slightly lower for version 17 compared to version 16, but the big difference is in the used memory, which is 3,5x smaller.
Also, when looking at the file size for the custom dump or the file size of the table-of-contents (TOC) file, the difference becomes very clear:
$ ls -lh lo_test_1?.dmp | awk '{print $5 " " $9}'
211M lo_test_16.dmp
29M lo_test_17.dmp
$ ls -lh lo_test_1?.dir/toc.dat | awk '{print $5 " " $9}'
185M lo_test_16.dir/toc.dat
6,9M lo_test_17.dir/toc.dat
The custom dump is roughly 7x smaller while the TOC file of the directory dump is around 25x smaller. We also tested for different numbers of large objects (from 50k to 1.5 million) and found only a slight variance in those ratios: the used memory ratio increases from around 2x at 50k to 4x at 1.5 million while the TOC ratio goes down from around 30x at 50k to 25x at 1.5 million.
Conclusion
The changes regarding dumps of large objects in Postgres 17 are very welcome for users with a huge number of large objects. Memory requirements are much lower on PostgreSQL 17 compared to earlier versions, both for dumps in custom and directory format.
Unfortunately, neither the number of files in the directory nor the directory size changes much, each large object is still dumped as its own file, which can lead to problems if there are a lot files:
$ for version in 16 17; do echo -n "$version: "; find lo_test_$version.dir/ | wc -l; done
16: 1000003
17: 1001002
$ du -s -h lo_test_??.dir
4,1G    lo_test_16.dir
3,9G    lo_test_17.dir
This might be an area for future improvements in Postgres 18 and beyond.
The issue of table and index bloat due to failed inserts on unique constraints is well known and has been discussed in various articles across the internet. However, these discussions sometimes lack a clear, practical example with measurements to illustrate the impact. And despite the familiarity of this issue, we still frequently see this design pattern—or rather, anti-pattern—in real-world applications. Developers often rely on unique constraints to prevent duplicate values from being inserted into tables. While this approach is straightforward, versatile, and generally considered effective, in PostgreSQL, inserts that fail due to unique constraint violations unfortunately always lead to table and index bloat. And on high-traffic systems, this unnecessary bloat can significantly increase disk I/O and the frequency of autovacuum runs. In this article, we aim to highlight this problem once again and provide a straightforward example with measurements to illustrate it. We suggest simple improvement that can help mitigate this issue and reduce autovacuum workload and disk I/O.
Two Approaches to Duplicate Prevention
In PostgreSQL, there are two main ways to prevent duplicate values using unique constraints:
1. Standard Insert Command (INSERT INTO table)
The usual INSERT INTO table command attempts to insert data directly into the table. If the insert would result in a duplicate value, it fails with a “duplicate key value violates unique constraint” error. Since the command does not specify any duplicate checks, PostgreSQL internally immediately inserts the new row and only then begins updating indexes. When it encounters a unique index violation, it triggers the error and deletes the newly added row. The order of index updates is determined by their relation IDs, so the extent of index bloat depends on the order in which indexes were created. With repeated “unique constraint violation” errors, both the table and some indexes accumulate deleted records leading to bloat, and the resulting write operations increase disk I/O without achieving any useful outcome.
2. Conflict-Aware Insert (INSERT INTO table … ON CONFLICT DO NOTHING)
The INSERT INTO table ON CONFLICT DO NOTHING command behaves differently. Since it specifies that a conflict might occur, PostgreSQL first checks for potential duplicates before attempting to insert data. If a duplicate is found, PostgreSQL performs the specified action—in this case, “DO NOTHING”—and no error occurs. This clause was introduced in PostgreSQL 9.5, but some applications either still run on older PostgreSQL versions or retain legacy code when the database is upgraded. As a result, this conflict-handling option is often underutilized.
Testing Example
To be able to do testing we must start PostgreSQL with “autovacuum=off”. Otherwise with instance mostly idle, autovacuum will immediately process bloated objects and it would be unable to catch statistics. We create a simple testing example with multiple indexes:
CREATE TABLE IF NOT EXISTS test_unique_constraints(
  id serial primary key,
  unique_text_key text,
  unique_integer_key integer,
  some_other_bigint_column bigint,
  some_other_text_column text);

CREATE INDEX test_unique_constraints_some_other_bigint_column_idx ON test_unique_constraints (some_other_bigint_column );
CREATE INDEX test_unique_constraints_some_other_text_column_idx ON test_unique_constraints (some_other_text_column );
CREATE INDEX test_unique_constraints_unique_text_key_unique_integer_key__idx ON test_unique_constraints (unique_text_key, unique_integer_key, some_other_bigint_column );
CREATE UNIQUE test_unique_constraints_unique_integer_key_idx INDEX ON test_unique_constraints (unique_text_key );
CREATE UNIQUE test_unique_constraints_unique_text_key_idx INDEX ON test_unique_constraints (unique_integer_key );
And now we populate this table with unique data:
DO $$
BEGIN
  FOR i IN 1..1000 LOOP
    INSERT INTO test_unique_constraints
    (unique_text_key, unique_integer_key, some_other_bigint_column, some_other_text_column)
    VALUES (i::text, i, i, i::text);
  END LOOP;
END;
$$;
In the second step, we use a simple Python script to connect to the database, attempt to insert conflicting data, and close the session after an error. First, it sends 10,000 INSERT statements that conflict with the “test_unique_constraints_unique_int_key_idx” index, then another 10,000 INSERTs conflicting with “test_unique_constraints_unique_text_key_idx”. The entire test is done in a few dozen seconds, after which we inspect all objects using the “pgstattuple” extension. The following query lists all objects in a single output:
WITH maintable AS (SELECT oid, relname FROM pg_class WHERE relname = 'test_unique_constraints')
SELECT m.oid as relid, m.relname as relation, s.*
FROM maintable m
JOIN LATERAL (SELECT * FROM pgstattuple(m.oid)) s ON true
UNION ALL
SELECT i.indexrelid as relid, indexrelid::regclass::text as relation, s.*
FROM pg_index i
JOIN LATERAL (SELECT * FROM pgstattuple(i.indexrelid)) s ON true
WHERE i.indrelid::regclass::text = 'test_unique_constraints'
ORDER BY relid;
Observed Results
After running the whole test several times, we observe the following:
- The main table “test_unique_constraints” always has 1,000 live tuples, and 20,000 additional dead records, resulting in approx 85% of dead tuples in the table
- Index on primary key always shows 21,000 tuples, unaware that 20,000 of these records are marked as deleted in the main table.
- Other non unique indexes show different results in different runs, ranging between 3,000 and 21,000 records. Numbers depend on the distribution of values generated for underlying columns by the script. We tested both repeated and completely unique values. Repeated values resulted in less records in indexes, completely unique values led to full count of 21,000 records in these indexes.
- Unique indexes showed repeatedly tuple counts only between 1,000 and 1,400 in all tests. Unique index on the “unique_text_key” always shows some dead tuples in the output. Precise explanation of these numbers would require deeper inspection of these relations and code of the pgstattuple function, which is beyond scope of this article. But some small bloat is reported also here.
- Numbers reported by pgstattuple function raised questions about their accuracy, although documentation seems to lead to the conclusion that numbers should be precise on tuple level.
- Subsequent manual vacuum confirms 20,000 dead records in the main table and 54 pages removed from primary key index, and up to several dozens of pages removed from other indexes – different numbers in each run in dependency on total count of tuples in these relations as described above.
- Each failed insert also increments the Transaction ID and thus increases the database’s transaction age.
Here is one example output from the query shown above after the test run which used unique values for all columns. As we can see, bloat of non unique indexes due to failed inserts can be big.
 relid |                       relation                                  | table_len | tuple_count | tuple_len | tuple_percent | dead_tuple_count | dead_tuple_len | dead_tuple_percent | free_space | free_percent
-------+-----------------------------------------------------------------+-----------+-------------+-----------+---------------+------------------+----------------+--------------------+------------+--------------
 16418 | test_unique_constraints                                         |   1269760 |        1000 |     51893 |          4.09 |            20000 |        1080000 |              85.06 |       5420 |         0.43
 16424 | test_unique_constraints_pkey                                    |    491520 |       21000 |    336000 |         68.36 |                0 |              0 |                  0 |      51444 |        10.47
 16426 | test_unique_constraints_some_other_bigint_column_idx            |    581632 |       16396 |    326536 |         56.14 |                0 |              0 |                  0 |     168732 |        29.01
 16427 | test_unique_constraints_some_other_text_column_idx              |    516096 |       16815 |    327176 |         63.39 |                0 |              0 |                  0 |     101392 |        19.65
 16428 | test_unique_constraints_unique_text_key_unique_integer_key__idx |   1015808 |       21000 |    584088 |          57.5 |                0 |              0 |                  0 |     323548 |        31.85
 16429 | test_unique_constraints_unique_text_key_idx                     |     57344 |        1263 |     20208 |         35.24 |                2 |             32 |               0.06 |      15360 |        26.79
 16430 | test_unique_constraints_unique_integer_key_idx                  |     40960 |        1000 |     16000 |         39.06 |                0 |              0 |                  0 |       4404 |        10.75
(7 rows)
In a second test, we modify the script to include the ON CONFLICT DO NOTHING clause in the INSERT command and repeat both tests. This time, inserts do not result in errors; instead, they simply return “INSERT 0 0”, indicating that no records were inserted. Inspection of the Transaction ID after this test shows only a minimal increase, caused by background processes. Attempts to insert conflicting data did not result in increase of Transaction ID (XID), as PostgreSQL started first only virtual transaction to check for conflicts, and because a conflict was found, it aborted the transaction without having assigned a new XID. The “pgstattuple” output confirms that all objects contain only live data, with no dead tuples this time.
Summary
As demonstrated, each failed insert bloats the underlying table and some indexes, and increases the Transaction ID because each failed insert occurs in a separate transaction. Consequently, autovacuum is forced to run more frequently, consuming valuable system resources. Therefore applications still relying solely on plain INSERT commands without ON CONFLICT conditions should consider reviewing this implementation. But as always, the final decision should be based on the specific conditions of each application.
TOAST (The Oversized Attribute Storage Technique) is PostgreSQL‘s mechanism for handling large data objects that exceed the 8KB data page limit. Introduced in PostgreSQL 7.1, TOAST is an improved version of the out-of-line storage mechanism used in Oracle databases for handling large objects (LOBs). Both databases store variable-length data either inline within the table or in a separate structure. PostgreSQL limits the maximum size of a single tuple to one data page. When the size of the tuple, including compressed data in a variable-length column, exceeds a certain threshold, the compressed part is moved to a separate data file and automatically chunked to optimize performance.
 TOAST can be used for storing long texts, binary data in bytea columns, JSONB data, HSTORE long key-value pairs, large arrays, big XML documents, or custom-defined composite data types. Its behavior is influenced by two parameters: TOAST_TUPLE_THRESHOLD and TOAST_TUPLE_TARGET. The first is a hardcoded parameter defined in PostgreSQL source code in the heaptoast.h file, based on the MaximumBytesPerTuple function, which is calculated for four toast tuples per page, resulting in a 2000-byte limit. This hardcoded threshold prevents users from storing values that are too small in out-of-line storage, which would degrade performance. The second parameter, TOAST_TUPLE_TARGET, is a table-level storage parameter initialized to the same value as TOAST_TUPLE_THRESHOLD, but it can be adjusted for individual tables. It defines the minimum tuple length required before trying to compress and move long column values into TOAST tables.
In the source file heaptoast.h, a comment explains: “If a tuple is larger than TOAST_TUPLE_THRESHOLD, we will try to toast it down to no more than TOAST_TUPLE_TARGET bytes through compressing compressible fields and moving EXTENDED and EXTERNAL data out-of-line. The numbers need not be the same, though they currently are. It doesn’t make sense for TARGET to exceed THRESHOLD, but it could be useful to make it be smaller.” This means that in real tables, data stored directly in the tuple may or may not be compressed, depending on its size after compression. To check if columns are compressed and which algorithm is used, we can use the PostgreSQL system function pg_column_compression. Additionally, the pg_column_size function helps check the size of individual columns. PostgreSQL 17 introduces a new function, pg_column_toast_chunk_id, which indicates whether a column’s value is stored in the TOAST table.
In the latest PostgreSQL versions, two compression algorithms are used: PGLZ (PostgreSQL LZ) and LZ4. Both are variants of the LZ77 algorithm, but they are designed for different use cases. PGLZ is suitable for mixed text and numeric data, such as XML or JSON in text form, providing a balance between compression speed and ratio. It uses a sliding window mechanism to detect repeated sequences in the data, offering a reasonable balance between compression speed and compression ratio. LZ4, on the other hand, is a fast compression method designed for real-time scenarios. It offers high-speed compression and decompression, making it ideal for performance-sensitive applications. LZ4 is significantly faster than PGLZ, particularly for decompression, and processes data in fixed-size blocks (typically 64KB), using a hash table to find matches. This algorithm excels with binary data, such as images, audio, and video files.
In my internal research project aimed at understanding the performance of JSONB data under different use cases, I ran multiple performance tests on queries that process JSONB data. The results of some tests showed interesting and sometimes surprising performance differences between these algorithms. But presented examples are anecdotal and cannot be generalized. The aim of this article is to raise an awareness that there can be huge differences in performance, which vary depending on specific data and use cases and also on specific hardware. Therefore, these results cannot be applied blindly.
JSONB data is stored as a binary object with a tree structure, where keys and values are stored in separate cells, and keys at the same JSON level are stored in sorted order. Nested levels are stored as additional tree structures under their corresponding keys from the higher level. This structure means that retrieving data for the first keys in the top JSON layer is quicker than retrieving values for highly nested keys stored deeper in the binary tree. While this difference is usually negligible, it becomes significant in queries that perform sequential scans over the entire dataset, where these small delays can cumulatively degrade overall performance.
The dataset used for the tests consisted of GitHub historical events available as JSON objects from gharchive.org covering the first week of January 2023. I tested three different tables: one using PGLZ, one using LZ4, and one using EXTERNAL storage without compression. A Python script downloaded the data, unpacked it, and loaded it into the respective tables. Each table was loaded separately to prevent prior operations from influencing the PostgreSQL storage format.
The first noteworthy observation was the size difference between the tables. The table using LZ4 compression was the smallest, around 38GB, followed by the table using PGLZ at 41GB. The table using external storage without compression was significantly larger at 98GB. As the testing machines had only 32GB of RAM, none of the tables could fit entirely in memory, making disk I/O a significant factor in performance. About one-third of the records were stored in TOAST tables, which reflected a typical data size distribution seen by our clients.
To minimize caching effects, I performed several tests with multiple parallel sessions running testing queries, each with randomly chosen parameters. In addition to use cases involving different types of indexes, I also ran sequential scans across the entire table. Tests were repeated with varying numbers of parallel sessions to gather sufficient data points, and the same tests were conducted on all three tables with different compression algorithms.
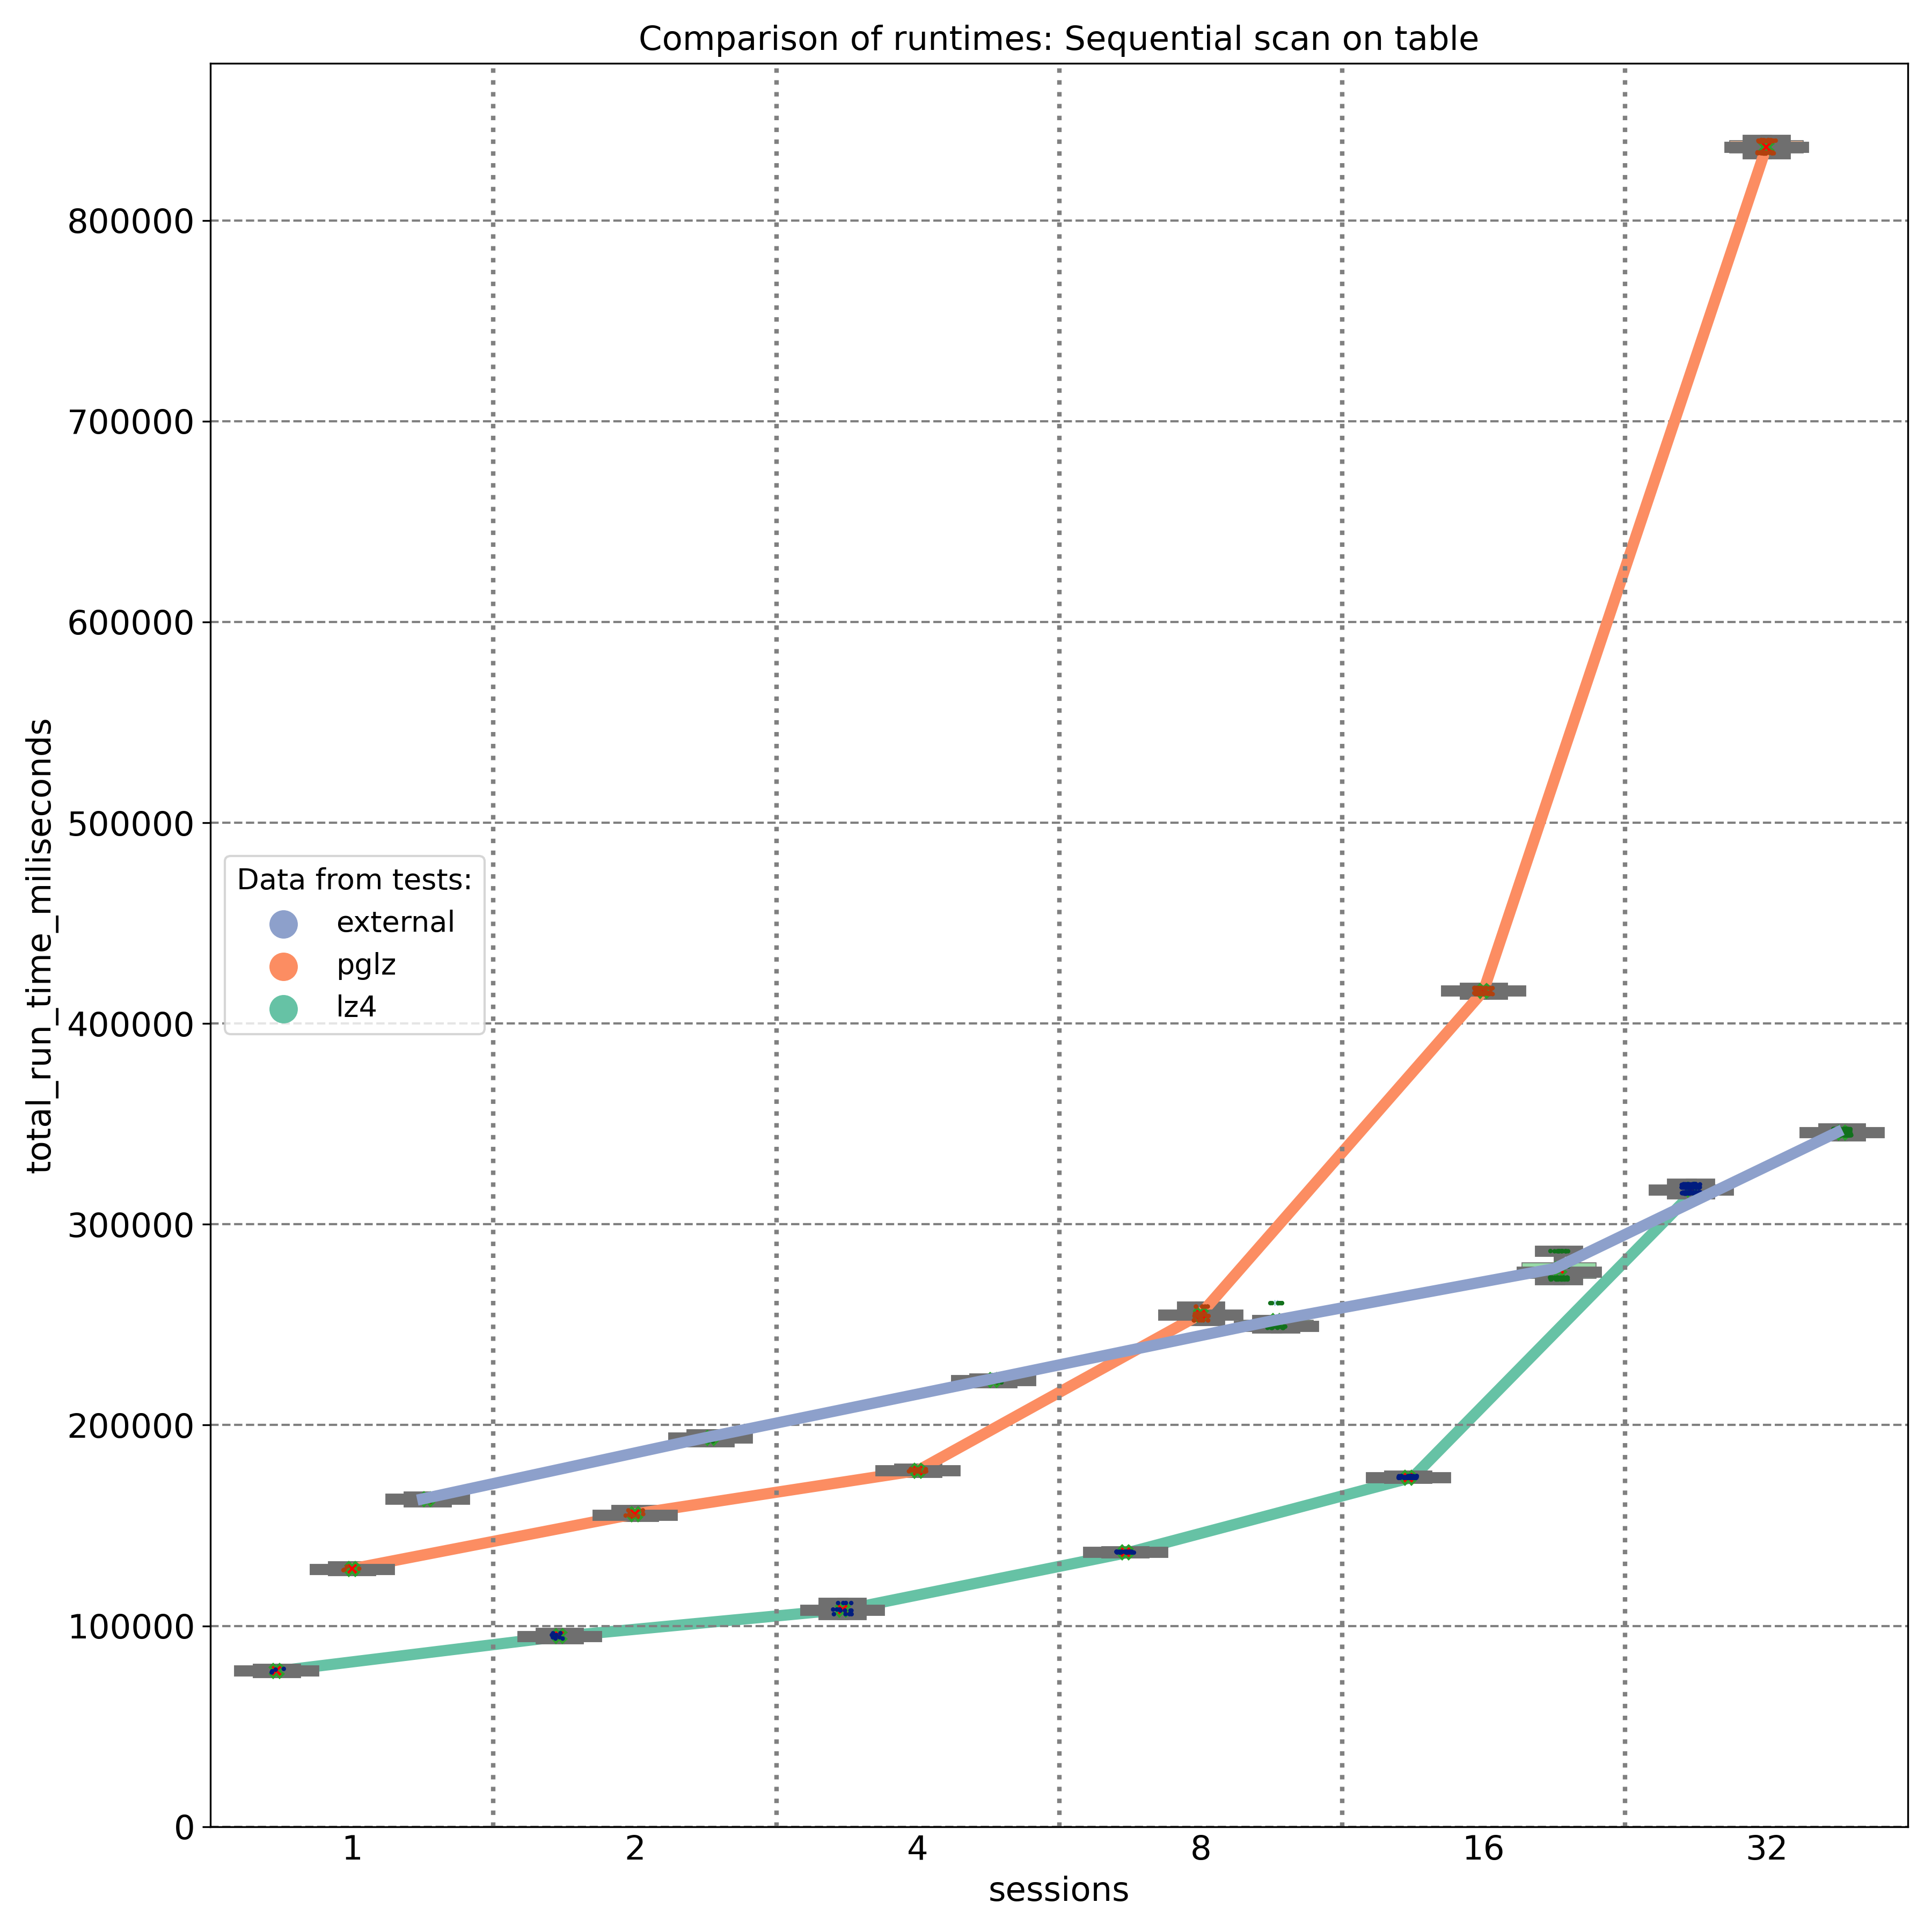
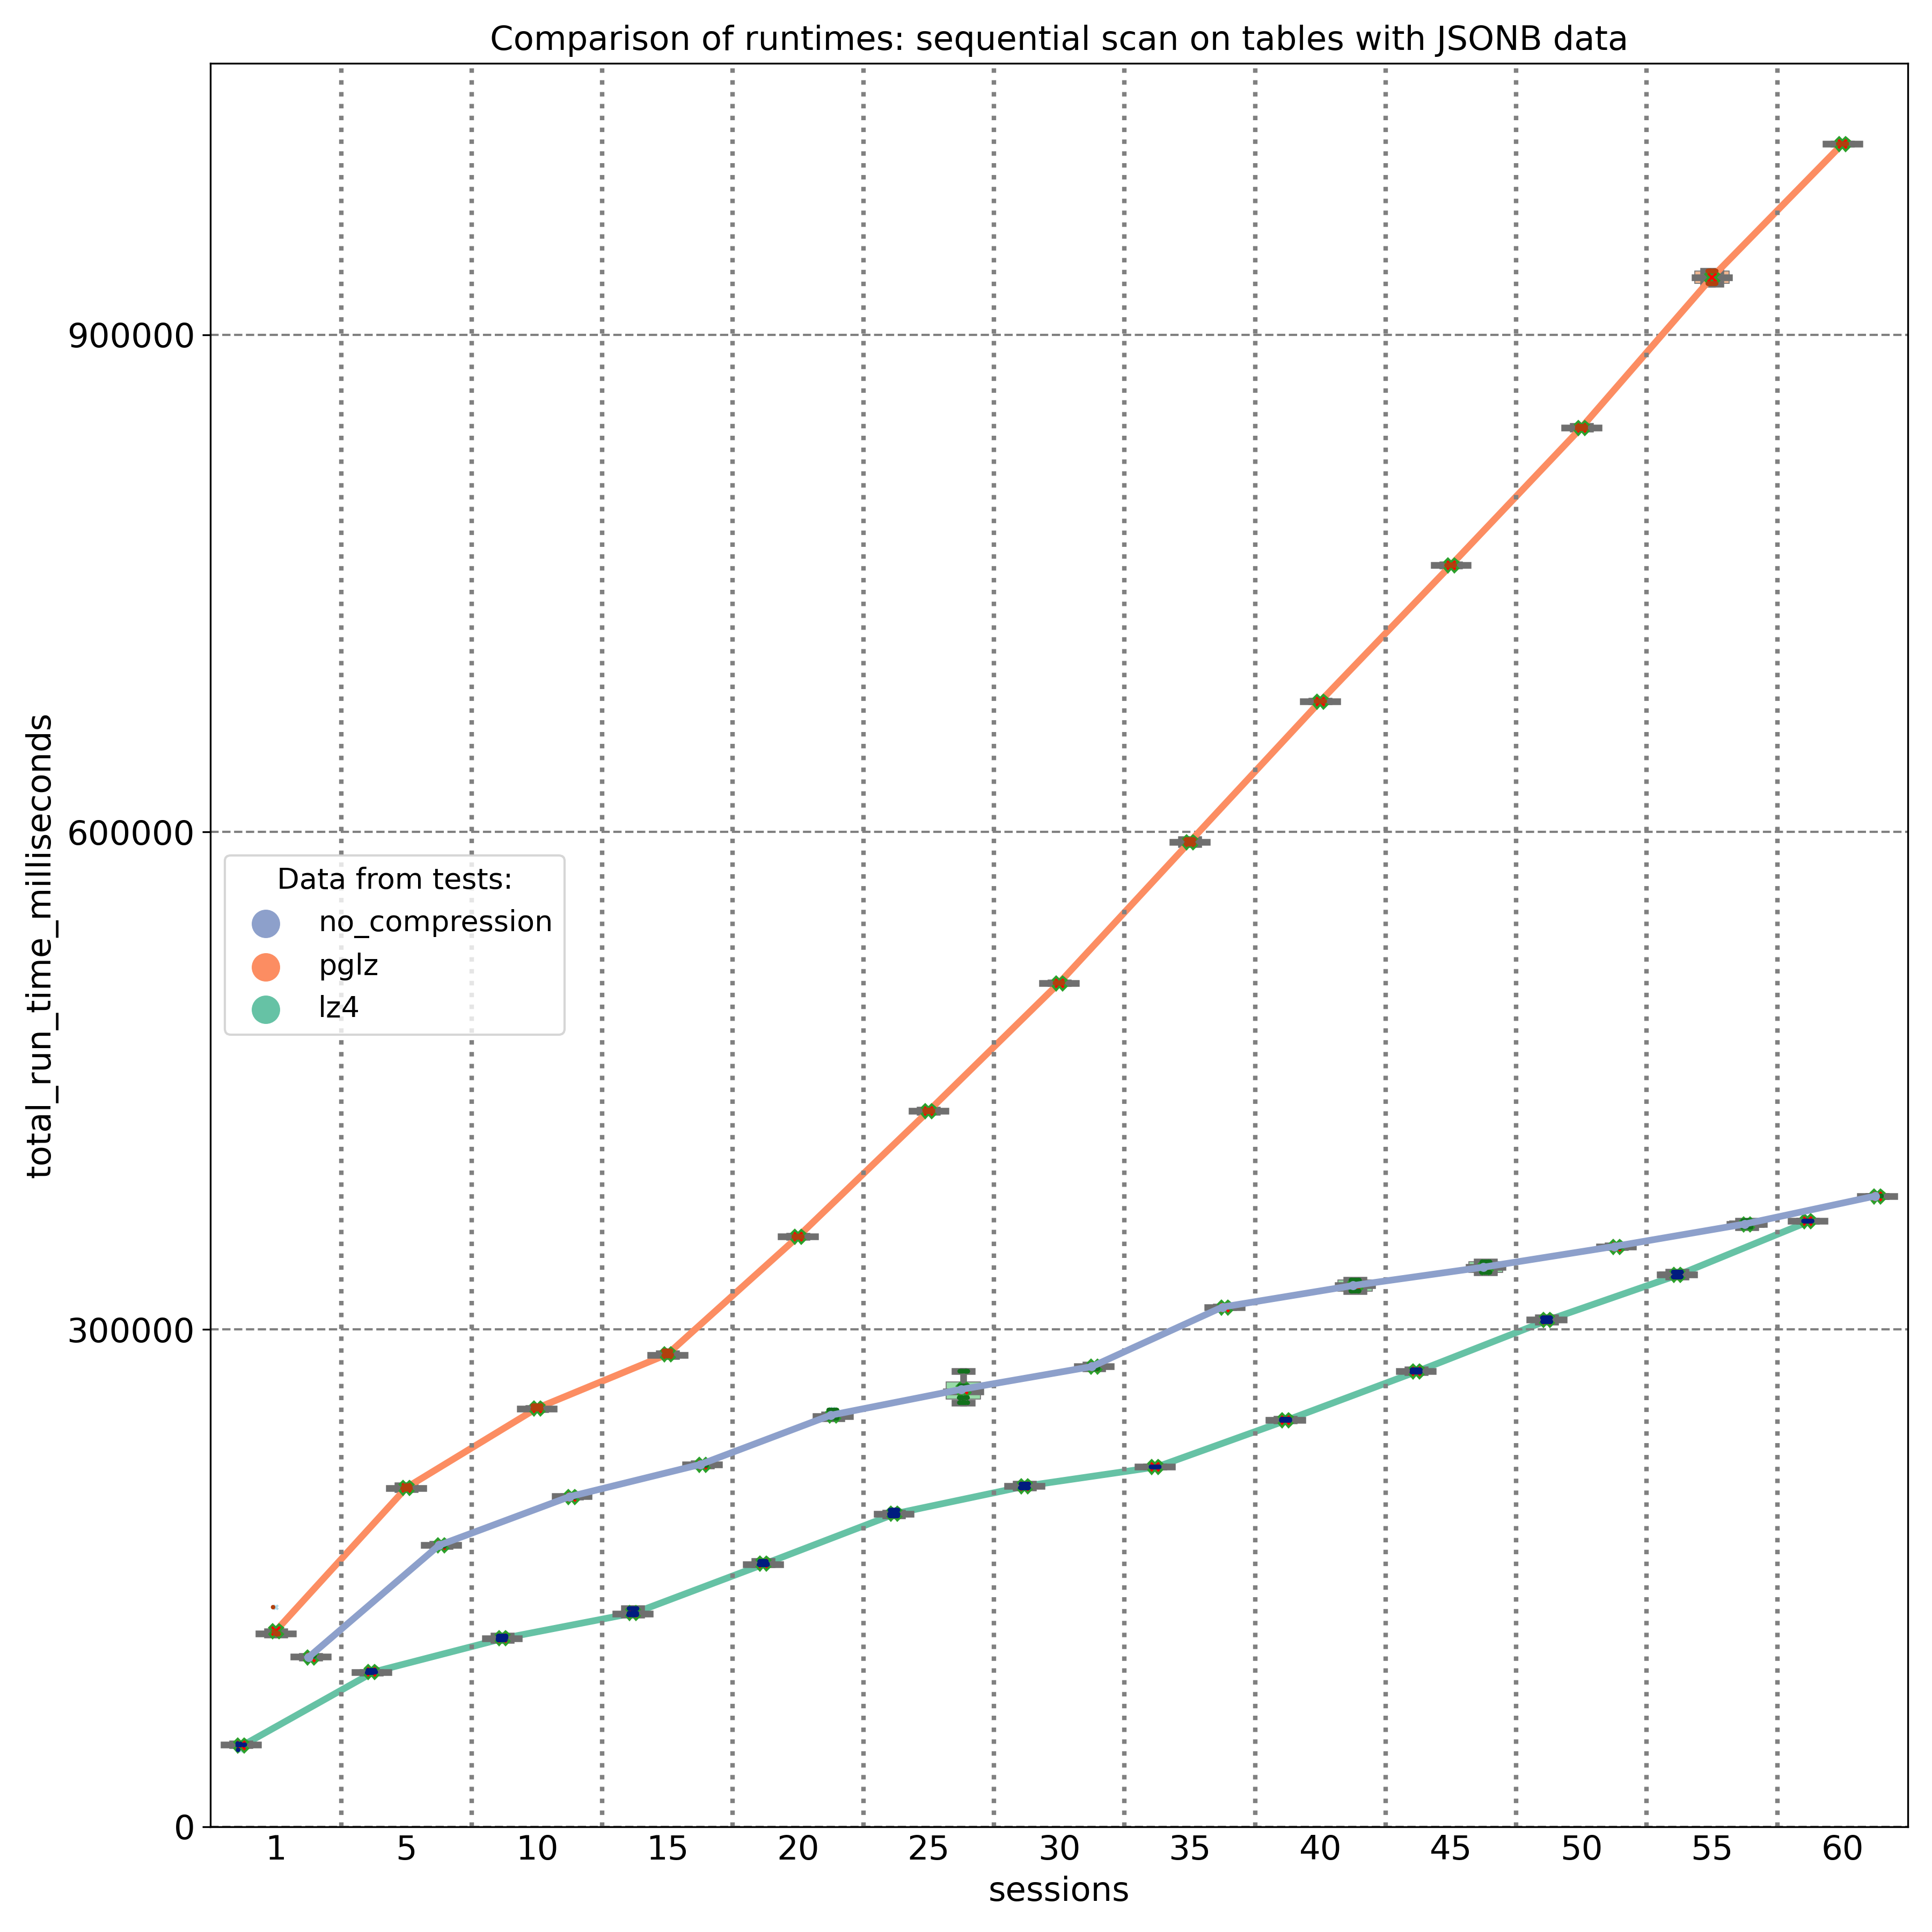
The first graph shows the results of select queries performing sequential scans, retrieving JSON keys stored at the beginning of the JSONB binary object. As expected, external storage without compression (blue line) provides nearly linear performance, with disk I/O being the primary factor. On an 8-core machine, the PGLZ algorithm (red line) performs reasonably well under smaller loads. However, as the number of parallel queries reaches the number of available CPU cores (8), its performance starts to degrade and becomes worse than the performance of uncompressed data. Under higher loads, it becomes a serious bottleneck. In contrast, LZ4 (green line) handles parallel queries exceptionally well, maintaining better performance than uncompressed data, even with up to 32 parallel queries on 8 cores.
The second test targeted JSONB keys stored at different positions (beginning, middle, and end) within the JSONB binary object. The results, measured on a 20-core machine, demonstrate that PGLZ (red line) is slower than the uncompressed table right from the start. In this case, the performance of PGLZ degrades linearly, rather than geometrically, but still lags significantly behind LZ4 (green line). LZ4 consistently outperformed uncompressed data throughout the test.
But if we decide to change the compression algorithm, simply creating a new table with the default_toast_compression setting set to “lz4” and running INSERT INTO my_table_lz4 SELECT \* FROM my_table_pglz; will not change the compression algorithm of existing records. Each already compressed record retains its original compression algorithm. You can use the pg_column_compression system function to check which algorithm was used for each record. The default compression setting only applies to new, uncompressed data; old, already compressed data is copied as-is.
To truly convert old data to a different compression algorithm, we need to recast it through text. For JSONB data, we would use a query like: INSERT INTO my_table_lz4 (jsonb_data, …) SELECT jsonb_data::text::jsonb, … FROM my_table_pglz; This ensures that old data is stored using the new LZ4 compression. However, this process can be time and resource-intensive, so it’s important to weigh the benefits before undertaking it.
To summarize it – my tests showed significant performance differences between the PGLZ and LZ4 algorithms for storing compressed JSONB data. These differences are particularly pronounced when the machine is under high parallel load. The tests showed a strong degradation in performance on data stored with PGLZ algorithm, when the number of parallel sessions exceeded the number of available cores. In some cases, PGLZ performed worse than uncompressed data right from the start. In contrast, LZ4 consistently outperformed both uncompressed and PGLZ-compressed data, especially under heavy loads. Setting LZ4 as the default compression for new data seems to be the right choice, and some cloud providers have already adopted this approach. However, these results should not be applied blindly to existing data. You should test your specific use cases and data to determine if conversion is worth the time and resource investment, as converting data requires re-casting and can be a resource-intensive process.
Introduction
Running ANALYZE (either explicitly or via auto-analyze) is very important in order to have uptodate data statistics for the Postgres query planner. In particular after in-place upgrades via pg_upgrade, ANALYZE needs to be run in order to have any query statistics at all. As ANALYZE samples only parts of the blocks in a table its I/O pattern looks more like random access than sequential read. Version 14 of Postgres has gained the possibility to use prefetching (if available, but this is the case on Linux) to tell the operating system kernel which blocks it will look at next. This is controlled via the maintenenance_io_concurrency configuration parameter, which is set to 10 by default (contrary to effective_io_concurrency, which is set to 1 by default).
Benchmark
In order to test and demonstrate the changes between version 13 and 14, we have done some quick benchmarks using the current maintenance releases (13.16 and 14.13) on Debian 12 with packages from https://apt.postgresql.org. Hardware-wise, a ThinkPad T14s Gen 3 with a Intel i7-1280P CPU with 20 cores and 32 GB of RAM was used. The basis is a pgbench database, initialized with scale factor of 1000:
$ pgbench -i -I dtg -s 1000 -d pgbenchThis creates 100 million rows and leads to a database size of around 15 GB. In order to have ANALYZE do a bit more work, we increase default_statistics_target from the default of 100 to the same value as the pgbench scale factor (i.e., 1000). This results in ANALYZE scanning around 20% of all blocks. We then analyze the main pgbench table, pgbench_accounts:
    $ vacuumdb -Z -v -d pgbench -t pgbench_accounts
    INFO:  analyzing "public.pgbench_accounts"
    INFO:  "pgbench_accounts": scanned 300000 of 1639345 pages,
           containing 18300000 live rows and 0 dead rows;
           300000 rows in sample, 100000045 estimated total rows
Between runs, the file system page cache is dropped via echo 3 | sudo tee /proc/sys/vm/drop_caches and all runs are repeated three times. The following table lists the run-times (in seconds) of the above vacuumdb command for various settings of maintenance_io_concurrency:
| Version | 0 | 1 | 5 | 10 | 20 | 50 | 100 | 500 |
|---|---|---|---|---|---|---|---|---|
| 13 | 19.557 | 21.610 | 19.623 | 21.060 | 21.463 | 20.533 | 20.230 | 20.537 |
| 14 | 24.707 | 29.840 | 8.740 | 5.777 | 4.067 | 3.353 | 3.007 | 2.763 |
Analysis
Two things are very clear from those numbers: First, the run-times do not change for version 13, the value of maintenance_io_concurrency has no effect for this version. Second, once prefetching kicks in for version 14 (maintenance_io_concurrency is 5 or more), ANALYZE gets several times faster, up to a factor of 6-7x. The default value of maintenance_io_concurrency of 10 is already 3-4x faster and values larger than 50 show only minor further improvements, at least for this benchmark on this hardware. Also notable is that the run-times when prefetching is turned off (maintenance_io_concurrency=0) or only set to 1 are worse than for version 13, but as the default for maintenance_io_concurrency is 10, this should not affect anybody in practice.
Conclusion
Enabling prefetching for ANALYZE in version 14 of PostgreSQL has made statistics sampling much faster. The default value of 10 for maintenance_io_concurrency is already quite good, but we advise to increase it to 20-50 (or higher) in case high-performing local NVME storage is used. In a future quick benchmark, we plan to compare the ANALYZE performance for the major versions since 14. In particular, the upcoming 17 release promises some further improvements to ANALYZE due to the new streaming I/O interface.
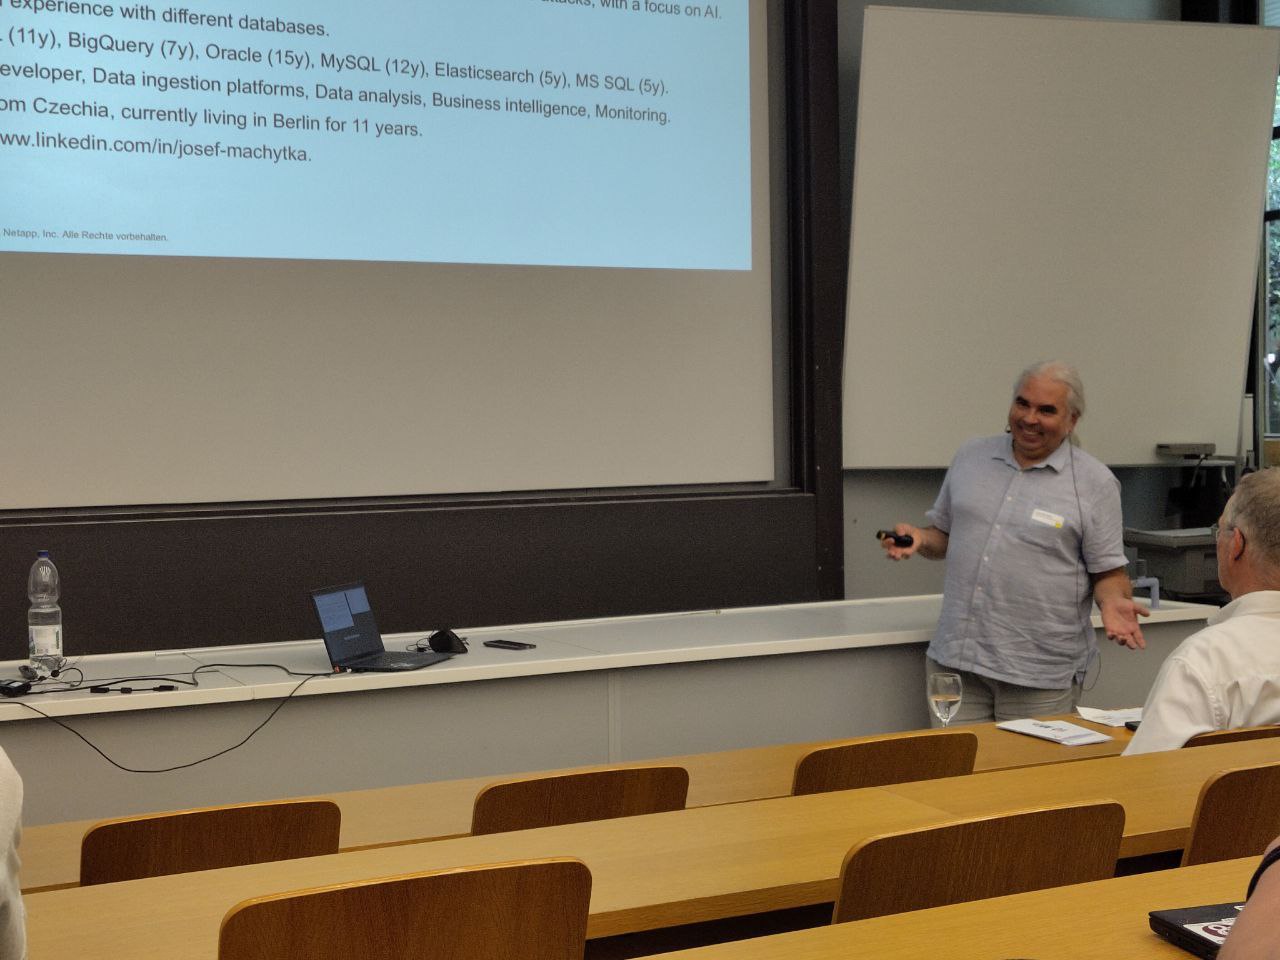
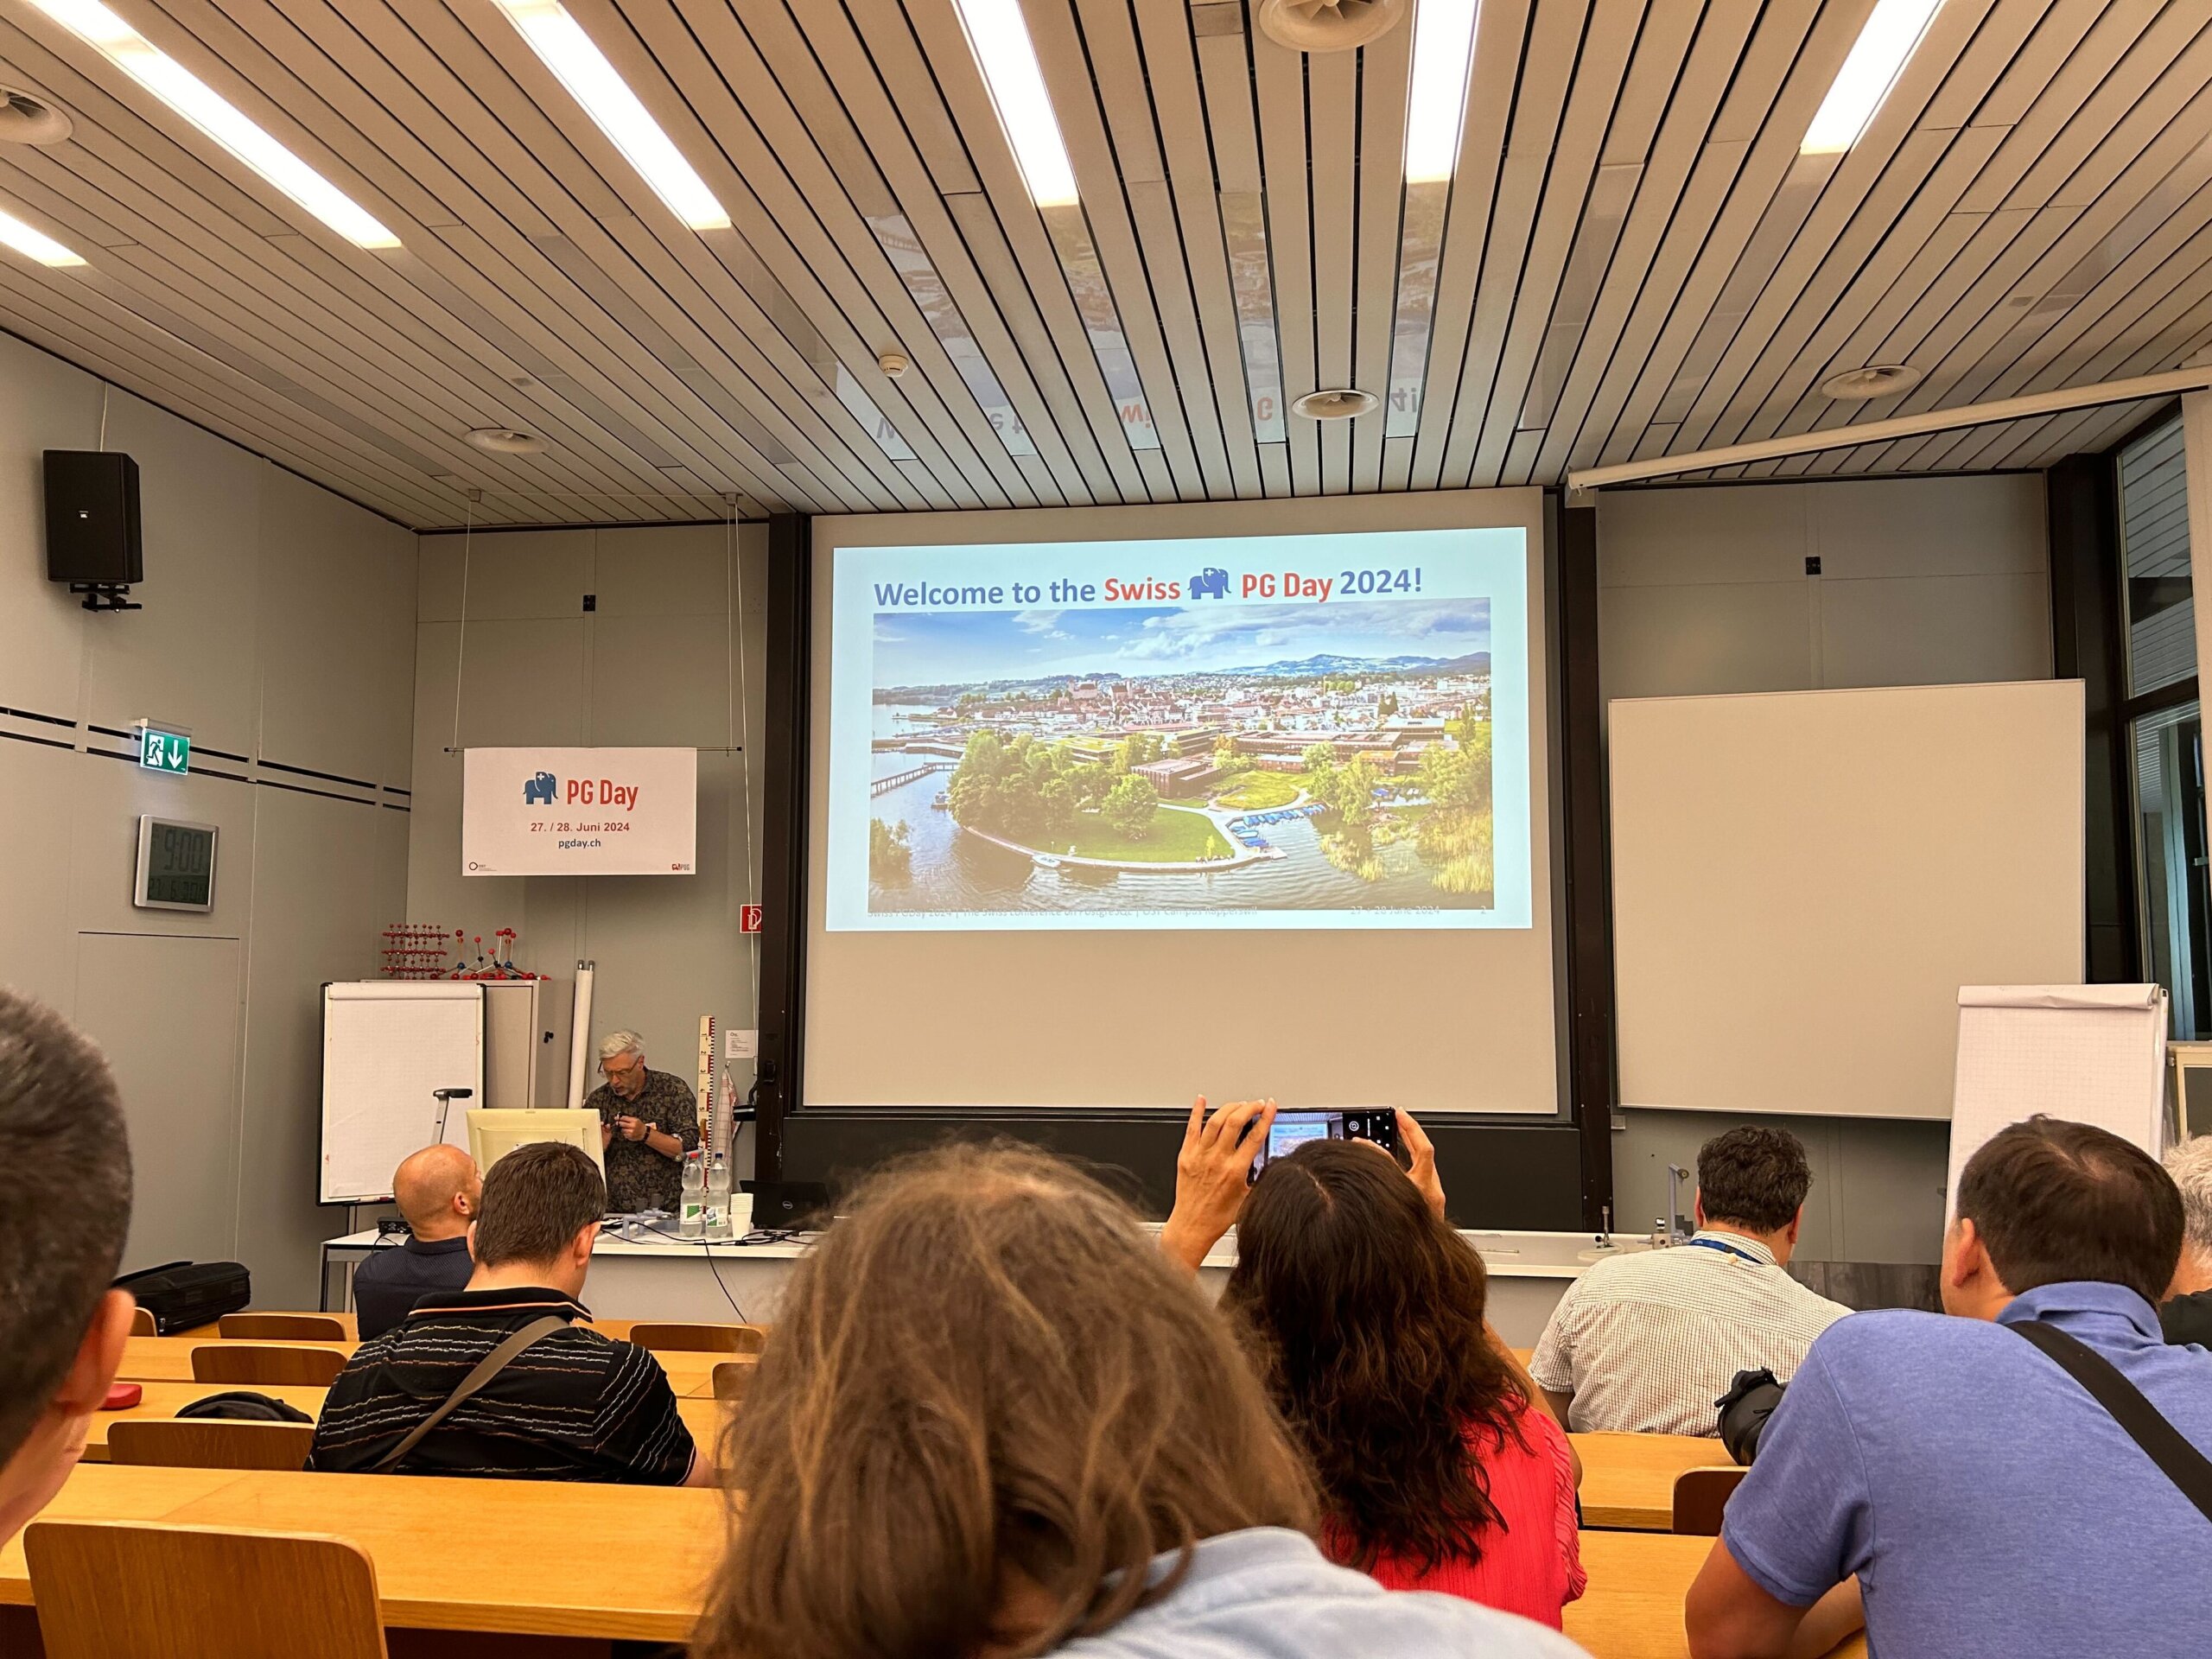
On Thursday, 27 June, and Friday, 28 June 2024, I had the amazing opportunity to attend Swiss PGDay 2024. The conference was held at the OST Eastern Switzerland University of Applied Sciences, Campus Rapperswil, which is beautifully situated on the banks of Lake Zurich in a nice, green environment. With approximately 110 attendees, the event had mainly a B2B focus, although not exclusively. Despite the conference being seemingly smaller in scale compared to PostgreSQL events in larger countries, it actually reflected perfectly the scope relevant for Switzerland.
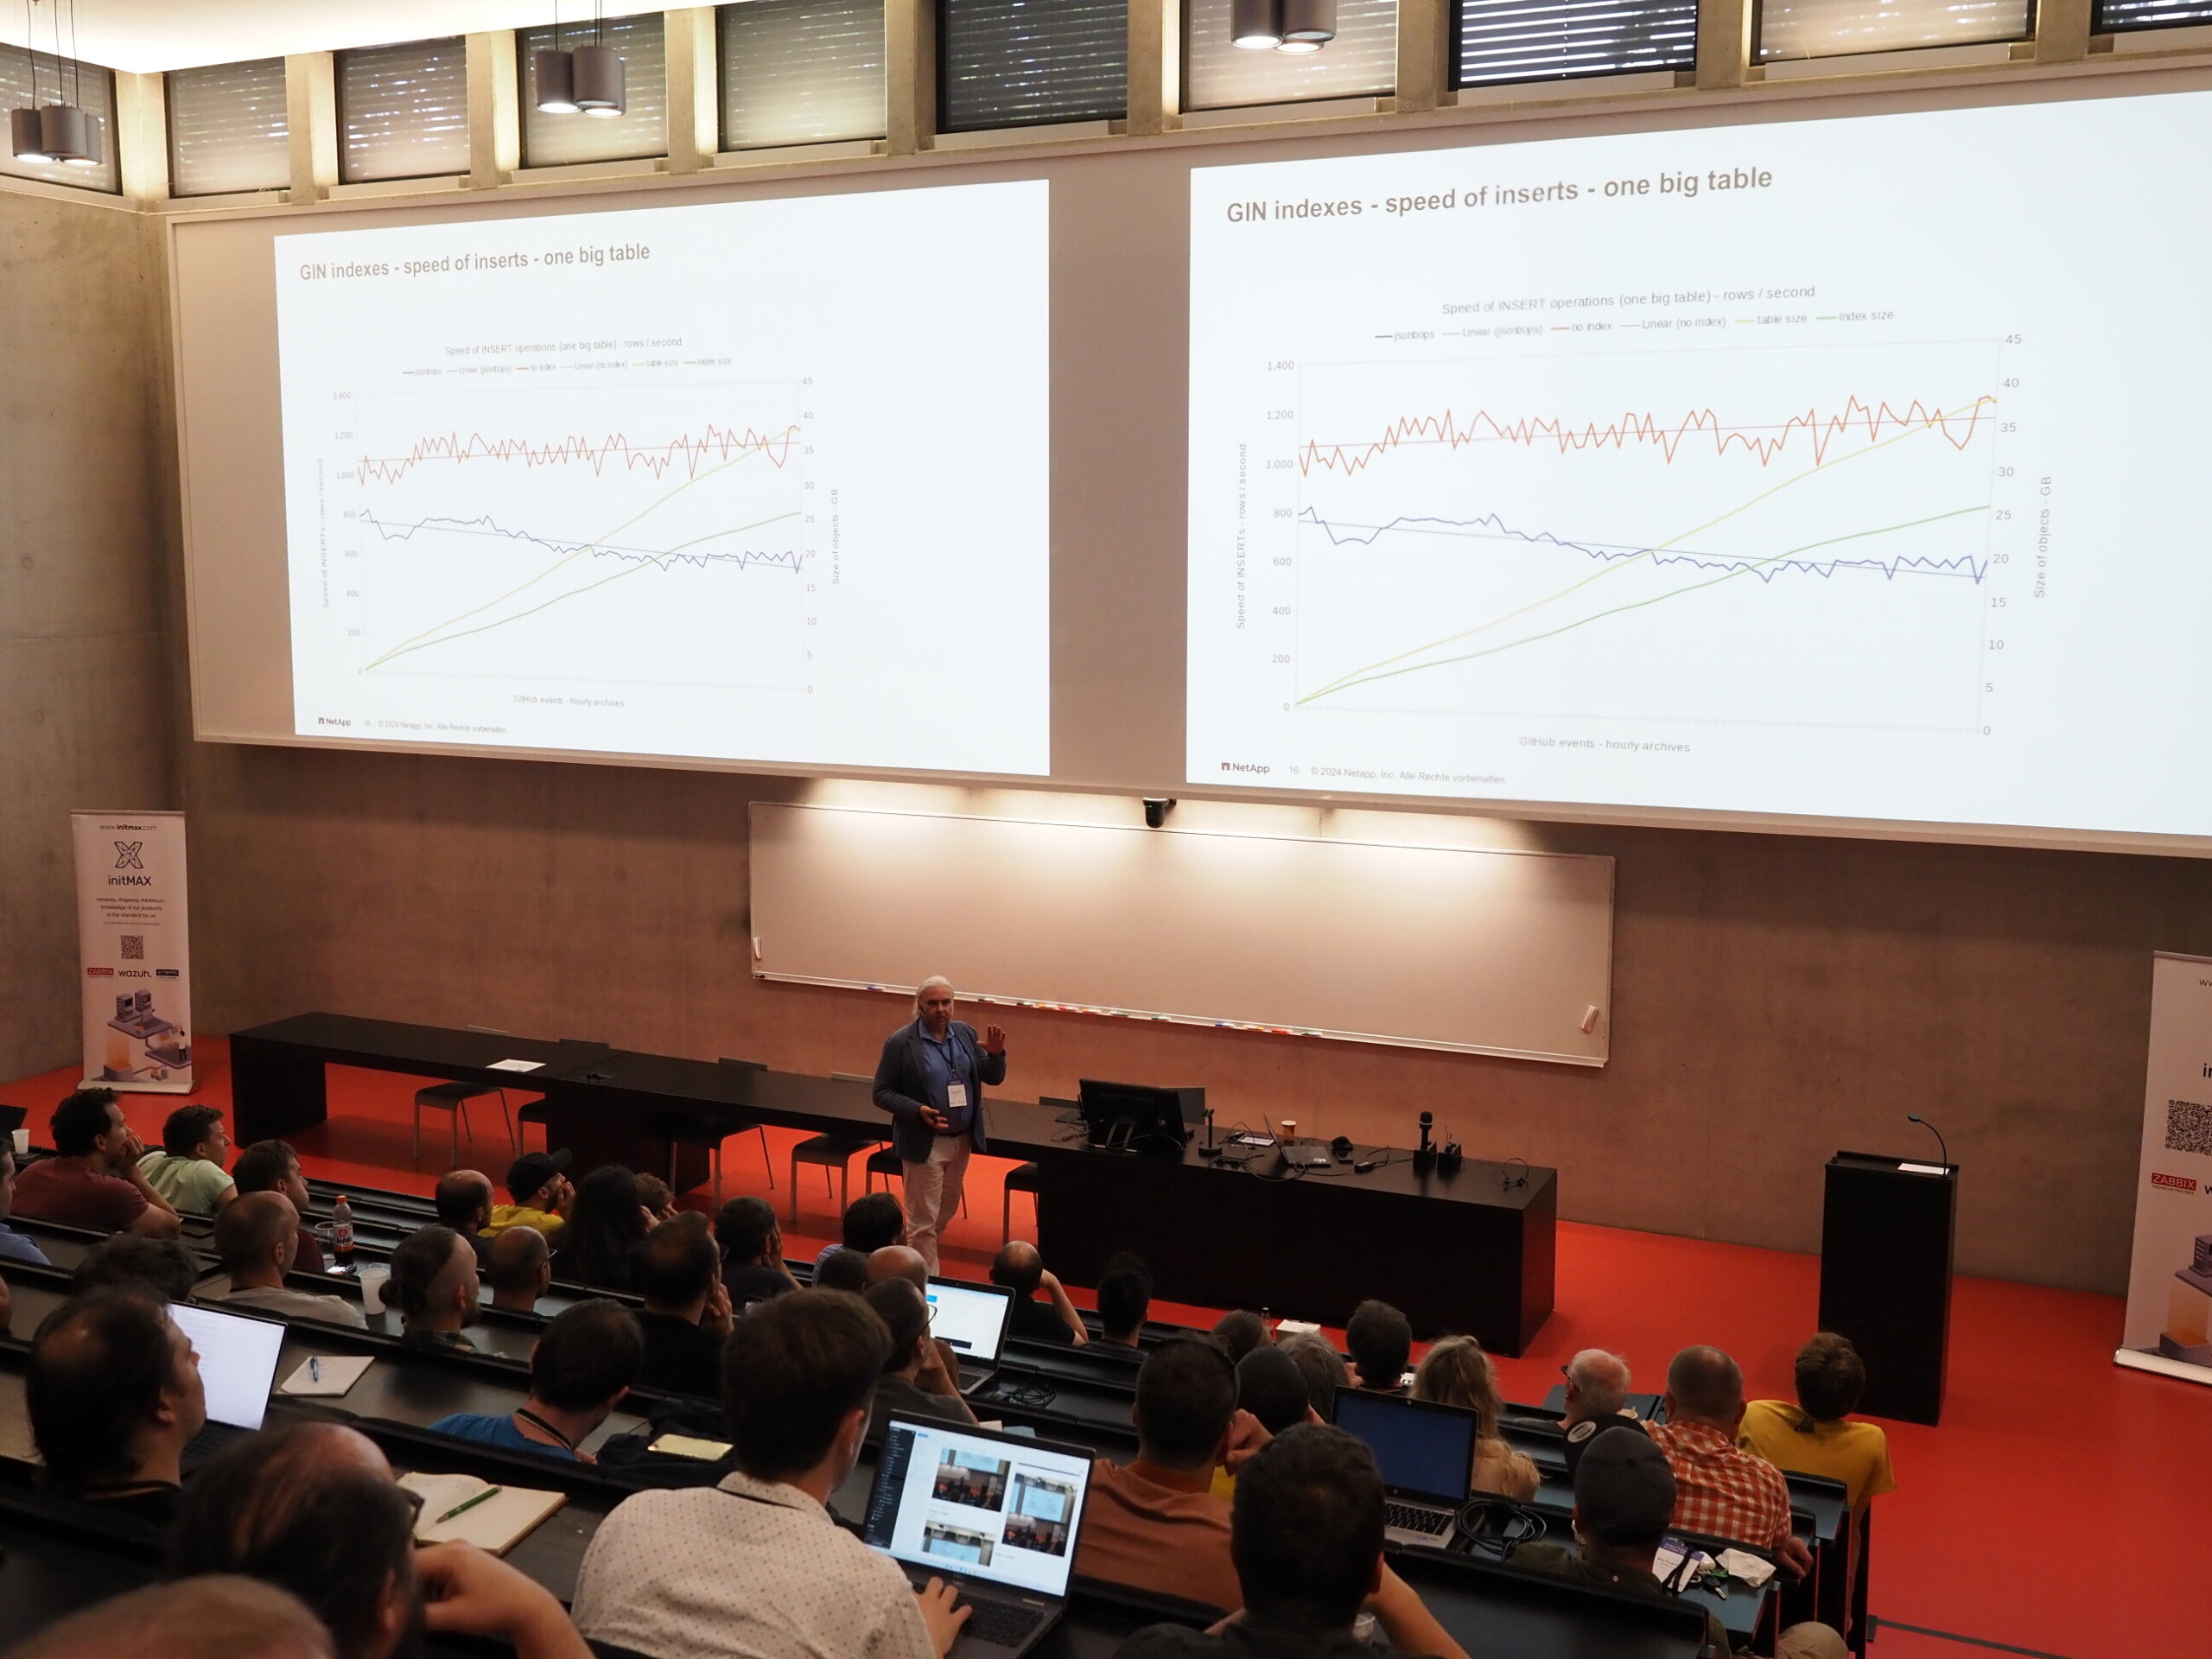
During the conference, I presented my talk “GIN, BTREE_GIN, GIST, BTREE_GIST, HASH & BTREE Indexes on JSONB Data“. The talk summarized the results of my long-term project at NetApp, including newer interesting findings compared to the presentation I gave in Prague at the beginning of June. As far as I could tell, my talk was well received by the audience, and I received very positive feedback.
At the very end on Friday, I also presented a lightning talk, “Can PostgreSQL Have a More Prominent Role in the AI Boom?” (my slides are at the end of the file). In this brief talk, I raised the question of whether it would be possible to implement AI functionality directly into PostgreSQL, including storing embedding models and trained neural networks within the database. Several people in the audience, involved with ML/AI, reacted positively on this proposal, acknowledging that PostgreSQL could indeed play a more significant role in ML and AI topics.
The conference featured two tracks of presentations, one in English and the other in German, allowing for a diverse range of topics and speakers. I would like to highlight some of them:
- Tomas Vondra presented “The Past and the Future of the Postgres Community“, explaining how work on PostgreSQL changes and fixes is organized in Commitfests and discussing future development ideas within the community.
- Laurenz Albe’s talk, “Sicherheitsattacken auf PostgreSQL“, highlighted several potential attack vectors in PostgreSQL, capturing significant attention with surprising examples.
- Chris Engelbert’s presentation, “PostgreSQL on Kubernetes: Dos and Don’ts“, addressed the main issues related to running PostgreSQL on Kubernetes and discussed solutions, including pros and cons of existing PostgreSQL Kubernetes operators.
- Maurizio De Giorgi and Ismael Posada Trobo discussed “Solving PostgreSQL Connection Scalability Issues: Insights from CERN’s GitLab Service“, detailing the challenges and solutions for scalability in CERN’s vast database environment.
- Dirk Krautschick’s talk, “Warum sich PostgreSQL-Fans auch für Kafka und Debezium interessieren sollten?“, showcased examples of using Debezium connectors and Kafka with PostgreSQL for various use cases, including data migrations.
- Patrick Stählin discussed “Wie wir einen Datenkorruptions-Bug mit der Hilfe der Community gefunden und gefixt haben,” addressing issues with free space map files after migration to PostgreSQL 16.
- Marion Baumgartner’s presentation, “Geodaten-Management mit PostGIS,” provided interesting details about processing geo-data in PostgreSQL using the PostGIS extension.
- Prof. Stefan Keller, one of the main organizers and a professor of Data Engineering at Rapperswil OST University, presented “PostgreSQL: A Reliable and Extensible Multi-Model SQL Database“, discussing the multi-model structure of PostgreSQL amid declining interest in NoSQL solutions.
- Luigi Nardi from DBTune presented “Lessons Learned from Autotuning PostgreSQL“, describing an AI-based performance tuning tool developed by his company.
- Kanhaiya Lal and Belma Canik delved into “Beyond Keywords: AI-powered Text Search with pgvector for PostgreSQL,” exploring the use of the pgvector extension to enhance full-text search capabilities in PostgreSQL.
- Gabriele Bartolini, the creator of the PostgreSQL Kubernetes Operator “CloudNativePG,” discussed the history and capabilities of this operator in his talk, “Unleashing the Power of PostgreSQL in Kubernetes“.
At the end of the first day, all participants were invited to a social event for networking and personal exchange, which was very well organized. I would like to acknowledge the hard work and dedication of all the organizers and thank them for their efforts. Swiss PGDay 2024 was truly a memorable and valuable experience, offering great learning opportunities. I am grateful for the chance to participate and contribute to the conference, and I look forward to future editions of this event. I am also very thankful to NetApp-credativ for making my participation in the conference possible.
Photos by organizers, Gülçin Yıldırım Jelínek and author:


Hashicorp Terraform is a well-known infrastructure automation tool mostly targeting cloud deployments. Instaclustr (a part of NetApp’s CloudOps division and credativ’s parent company) provides a managed service for various data stores, including PostgreSQL. Provisioning managed clusters is possible via the Instaclustr console, a REST API or through the Instaclustr Terraform Provider.
In this first part of a blog series, it is shown how a Postgres cluster can be provisioned using the Instaclustr Terraform Provider, including whitelisting the IP address and finally connecting to it via the psql command-line client.
Initial Setup
The general requirement is having an account for the Instaclustr Managed service. The web console is located at https://console2.instaclustr.com/. Next, a provisioning API key needs to be created if not available already, as explained here.
Terraform providers are usually defined and configured in a file called provider.tf. For the Instaclustr Terraform provider, this means adding it to the list of required providers and setting the API key mentioned above:
terraform {
  required_providers {
    instaclustr = {
      source  = "instaclustr/instaclustr"
      version = ">= 2.0.0, < 3.0.0"
    }
  }
}

variable "ic_username" {
  type = string
}
variable "ic_api_key" {
  type = string
}

provider "instaclustr" {
    terraform_key = "Instaclustr-Terraform ${var.ic_username}:${var.ic_api_key}"
}
Here, ic_username and ic_api_key are defined as variables. They should be set in a terraform.tfvars file in the same directory
ic_username       = "username"
ic_api_key        = "0db87a8bd1[...]"
As the final preparatory step, Terraform needs to be initialized, installing the provider:
$ terraform init

Initializing the backend...

Initializing provider plugins...
- Finding instaclustr/instaclustr versions matching ">= 2.0.0, < 3.0.0"...
- Installing instaclustr/instaclustr v2.0.136...
- Installed instaclustr/instaclustr v2.0.136 (self-signed, key ID 58D5F4E6CBB68583)

[...]

Terraform has been successfully initialized!
Defining Resources
Terraform resources define infrastructure objects, in our case a managed PostgreSQL cluster. Customarily, they are defined in a main.tf file, but any other file name can be chosen:
resource "instaclustr_postgresql_cluster_v2" "main" {
  name                    = "username-test1"
  postgresql_version      = "16.2.0"
  private_network_cluster = false
  sla_tier                = "NON_PRODUCTION"
  synchronous_mode_strict = false
  data_centre {
    name                         = "AWS_VPC_US_EAST_1"
    cloud_provider               = "AWS_VPC"
    region                       = "US_EAST_1"
    node_size                    = "PGS-DEV-t4g.small-5"
    number_of_nodes              = "2"
    network                      = "10.4.0.0/16"
    client_to_cluster_encryption = true
    intra_data_centre_replication {
      replication_mode           = "ASYNCHRONOUS"
    }
    inter_data_centre_replication {
      is_primary_data_centre = true
    }
  }
}
The above defines a 2-node cluster named username-test1 (and referred to internally as main by Terraform) in the AWS US_EAST_1 region with PGS-DEV-t4g.small-5 instance sizes (2 vCores, 2 GB RAM, 5 GB data disk) for the nodes. Test/developer instance sizes for the other cloud providers would be:
| Cloud Provider | Default Region | Instance Size | Data Disk | RAM | CPU |
|---|---|---|---|---|---|
AWS_VPC | US_EAST_1 | PGS-DEV-t4g.small-5 | 5 GB | 2 GB | 2 Cores |
AWS_VPC | US_EAST_1 | PGS-DEV-t4g.medium-30 | 30 GB | 4 GB | 2 Cores |
AZURE_AZ | CENTRAL_US | PGS-DEV-Standard_DS1_v2-5-an | 5 GB | 3.5 GB | 1 Core |
AZURE_AZ | CENTRAL_US | PGS-DEV-Standard_DS1_v2-30-an | 30 GB | 3.5 GB | 1 Core |
GCP | us-west1 | PGS-DEV-n2-standard-2-5 | 5 GB | 8 GB | 2 Cores |
GCP | us-west1 | PGS-DEV-n2-standard-2-30 | 30 GB | 8 GB | 2 Core |
Other instance sizes or regions can be looked up in the console or in the section node_size of the Instaclustr Terraform Provider documentation.
Running Terraform
Before letting Terraform provision the defined resources, it is best-practice to run terraform plan. This lets Terraform plan the provisioning as a dry-run, and makes it possible to review the expected actions before creating any actual infrastructure:
$ terraform plan

Terraform used the selected providers to generate the following execution plan. Resource actions are
indicated with the following symbols:
  + create

Terraform will perform the following actions:

  # instaclustr_postgresql_cluster_v2.main will be created
  + resource "instaclustr_postgresql_cluster_v2" "main" {
      + current_cluster_operation_status = (known after apply)
      + default_user_password            = (sensitive value)
      + description                      = (known after apply)
      + id                               = (known after apply)
      + name                             = "username-test1"
      + pci_compliance_mode              = (known after apply)
      + postgresql_version               = "16.2.0"
      + private_network_cluster          = false
      + sla_tier                         = "NON_PRODUCTION"
      + status                           = (known after apply)
      + synchronous_mode_strict          = false

      + data_centre {
          + client_to_cluster_encryption     = true
          + cloud_provider                   = "AWS_VPC"
          + custom_subject_alternative_names = (known after apply)
          + id                               = (known after apply)
          + name                             = "AWS_VPC_US_EAST_1"
          + network                          = "10.4.0.0/16"
          + node_size                        = "PGS-DEV-t4g.small-5"
          + number_of_nodes                  = 2
          + provider_account_name            = (known after apply)
          + region                           = "US_EAST_1"
          + status                           = (known after apply)

          + intra_data_centre_replication {
              + replication_mode = "ASYNCHRONOUS"
            }
        }
    }

Plan: 1 to add, 0 to change, 0 to destroy.
[...]
When the planned output looks reasonable, it can be applied via terraform apply:
$ terraform apply

Terraform used the selected providers to generate the following execution plan. Resource actions are
indicated with the following symbols:
  + create
[...]
Plan: 1 to add, 0 to change, 0 to destroy.

Do you want to perform these actions?
  Terraform will perform the actions described above.
  Only 'yes' will be accepted to approve.

  Enter a value: yes

instaclustr_postgresql_cluster_v2.main: Creating...
instaclustr_postgresql_cluster_v2.main: Still creating... [10s elapsed]
[...]
instaclustr_postgresql_cluster_v2.main: Creation complete after 5m37s [id=704e1c20-bda6-410c-b95b-8d22ef3f5a04]

Apply complete! Resources: 1 added, 0 changed, 0 destroyed.
That is it! The PostgreSQL cluster is now up and running after barely 5 minutes.
IP Whitelisting
In order to access the PostgreSQL cluster, firewall rules need to be defined for IP-whitelisting. In general, any network address block can be defined, but in order to allow access from the host running Terraform, a firewall rule for the local public IP address can be set via a service like icanhazip.com, appending to main.tf:
data "http" "myip" {
  url = "https://ipecho.net/plain"
}

resource "instaclustr_cluster_network_firewall_rules_v2" "main" {
  cluster_id = resource.instaclustr_postgresql_cluster_v2.main.id

  firewall_rule {
    network = "${chomp(data.http.myip.response_body)}/32"
    type    = "POSTGRESQL"
  }
}
The usage of the http Terraform module also needs an update to the providers.tf file, adding it to the list of required providers:
terraform {
  required_providers {
    instaclustr = {
      source  = "instaclustr/instaclustr"
      version = ">= 2.0.0, < 3.0.0"
    }
    http = {
      source = "hashicorp/http"
      version = "3.4.3"
    }
  }
}
And a subsequent re-run of terraform init, followed by terraform apply:
$ terraform init

Initializing the backend...

Initializing provider plugins...
- Reusing previous version of instaclustr/instaclustr from the dependency lock file
- Finding hashicorp/http versions matching "3.4.3"...
- Using previously-installed instaclustr/instaclustr v2.0.136
- Installing hashicorp/http v3.4.3...
- Installed hashicorp/http v3.4.3 (signed by HashiCorp)

[...]
Terraform has been successfully initialized!
[...]

$ terraform apply

data.http.myip: Reading...
instaclustr_postgresql_cluster_v2.main: Refreshing state... [id=704e1c20-bda6-410c-b95b-8d22ef3f5a04]
data.http.myip: Read complete after 1s [id=https://ipv4.icanhazip.com]

Terraform used the selected providers to generate the following execution plan. Resource actions are
indicated with the following symbols:
  + create

Terraform will perform the following actions:

  # instaclustr_cluster_network_firewall_rules_v2.main will be created
  + resource "instaclustr_cluster_network_firewall_rules_v2" "main" {
      + cluster_id = "704e1c20-bda6-410c-b95b-8d22ef3f5a04"
      + id         = (known after apply)
      + status     = (known after apply)

      + firewall_rule {
          + deferred_reason = (known after apply)
          + id              = (known after apply)
          + network         = "123.134.145.5/32"
          + type            = "POSTGRESQL"
        }
    }

Plan: 1 to add, 0 to change, 0 to destroy.

Do you want to perform these actions?
  Terraform will perform the actions described above.
  Only 'yes' will be accepted to approve.

  Enter a value: yes

instaclustr_cluster_network_firewall_rules_v2.main: Creating...
instaclustr_cluster_network_firewall_rules_v2.main: Creation complete after 2s [id=704e1c20-bda6-410c-b95b-8d22ef3f5a04]

Apply complete! Resources: 1 added, 0 changed, 0 destroyed.
Connecting to the Cluster
In order to connect to the newly-provisioned Postgres cluster, we need the public IP addresses of the nodes, and the password of the administrative database user, icpostgresql. Those are retrieved and stored in the Terraform state by the Instaclustr Terraform provider, by default in a local file terraform.tfstate. To secure the password, one can change the password after initial connection, secure the host Terraform is run from, or store the Terraform state remotely.
The combined connection string can be setup as an output variable in a outputs.tf file:
output "connstr" {
  value = format("host=%s user=icpostgresql password=%s dbname=postgres target_session_attrs=read-write",
          join(",", [for node in instaclustr_postgresql_cluster_v2.main.data_centre[0].nodes:
               format("%s", node.public_address)]),
                      instaclustr_postgresql_cluster_v2.main.default_user_password
                )
  sensitive = true
}
After another terraform apply to set the output variable, it is possible to connect to the PostgreSQL cluster without having to type or paste the default password via:
$ psql "$(terraform output -raw connstr)"
psql (16.3 (Debian 16.3-1.pgdg120+1), server 16.2 (Debian 16.2-1.pgdg110+2))
SSL connection (protocol: TLSv1.3, cipher: TLS_AES_256_GCM_SHA384, compression: off)
Type "help" for help.

postgres=>
Conclusion
In this first part, the provisioning of an Instaclustr Managed PostgreSQL cluster with Terraform was demonstrated. In the next part of this blog series, we plan to present a Terraform module that makes it even easier to provision PostgreSQL clusters. We will also check out which input variables can be set to further customize the managed PostgreSQL cluster.
Instaclustr offers a 30-day free trial for its managed service which allows to provision clusters with development instance sizes, so you can signup and try the above yourself today!
On Wednesday, June 5th, I attended the Prague PostgreSQL Developers Day 2024. It is the premier PostgreSQL conference in the Czech Republic, and this year marked its 16th iteration. The event was held in the modern and convenient environment of the Czech Technical University and was attended by almost 270 participants.
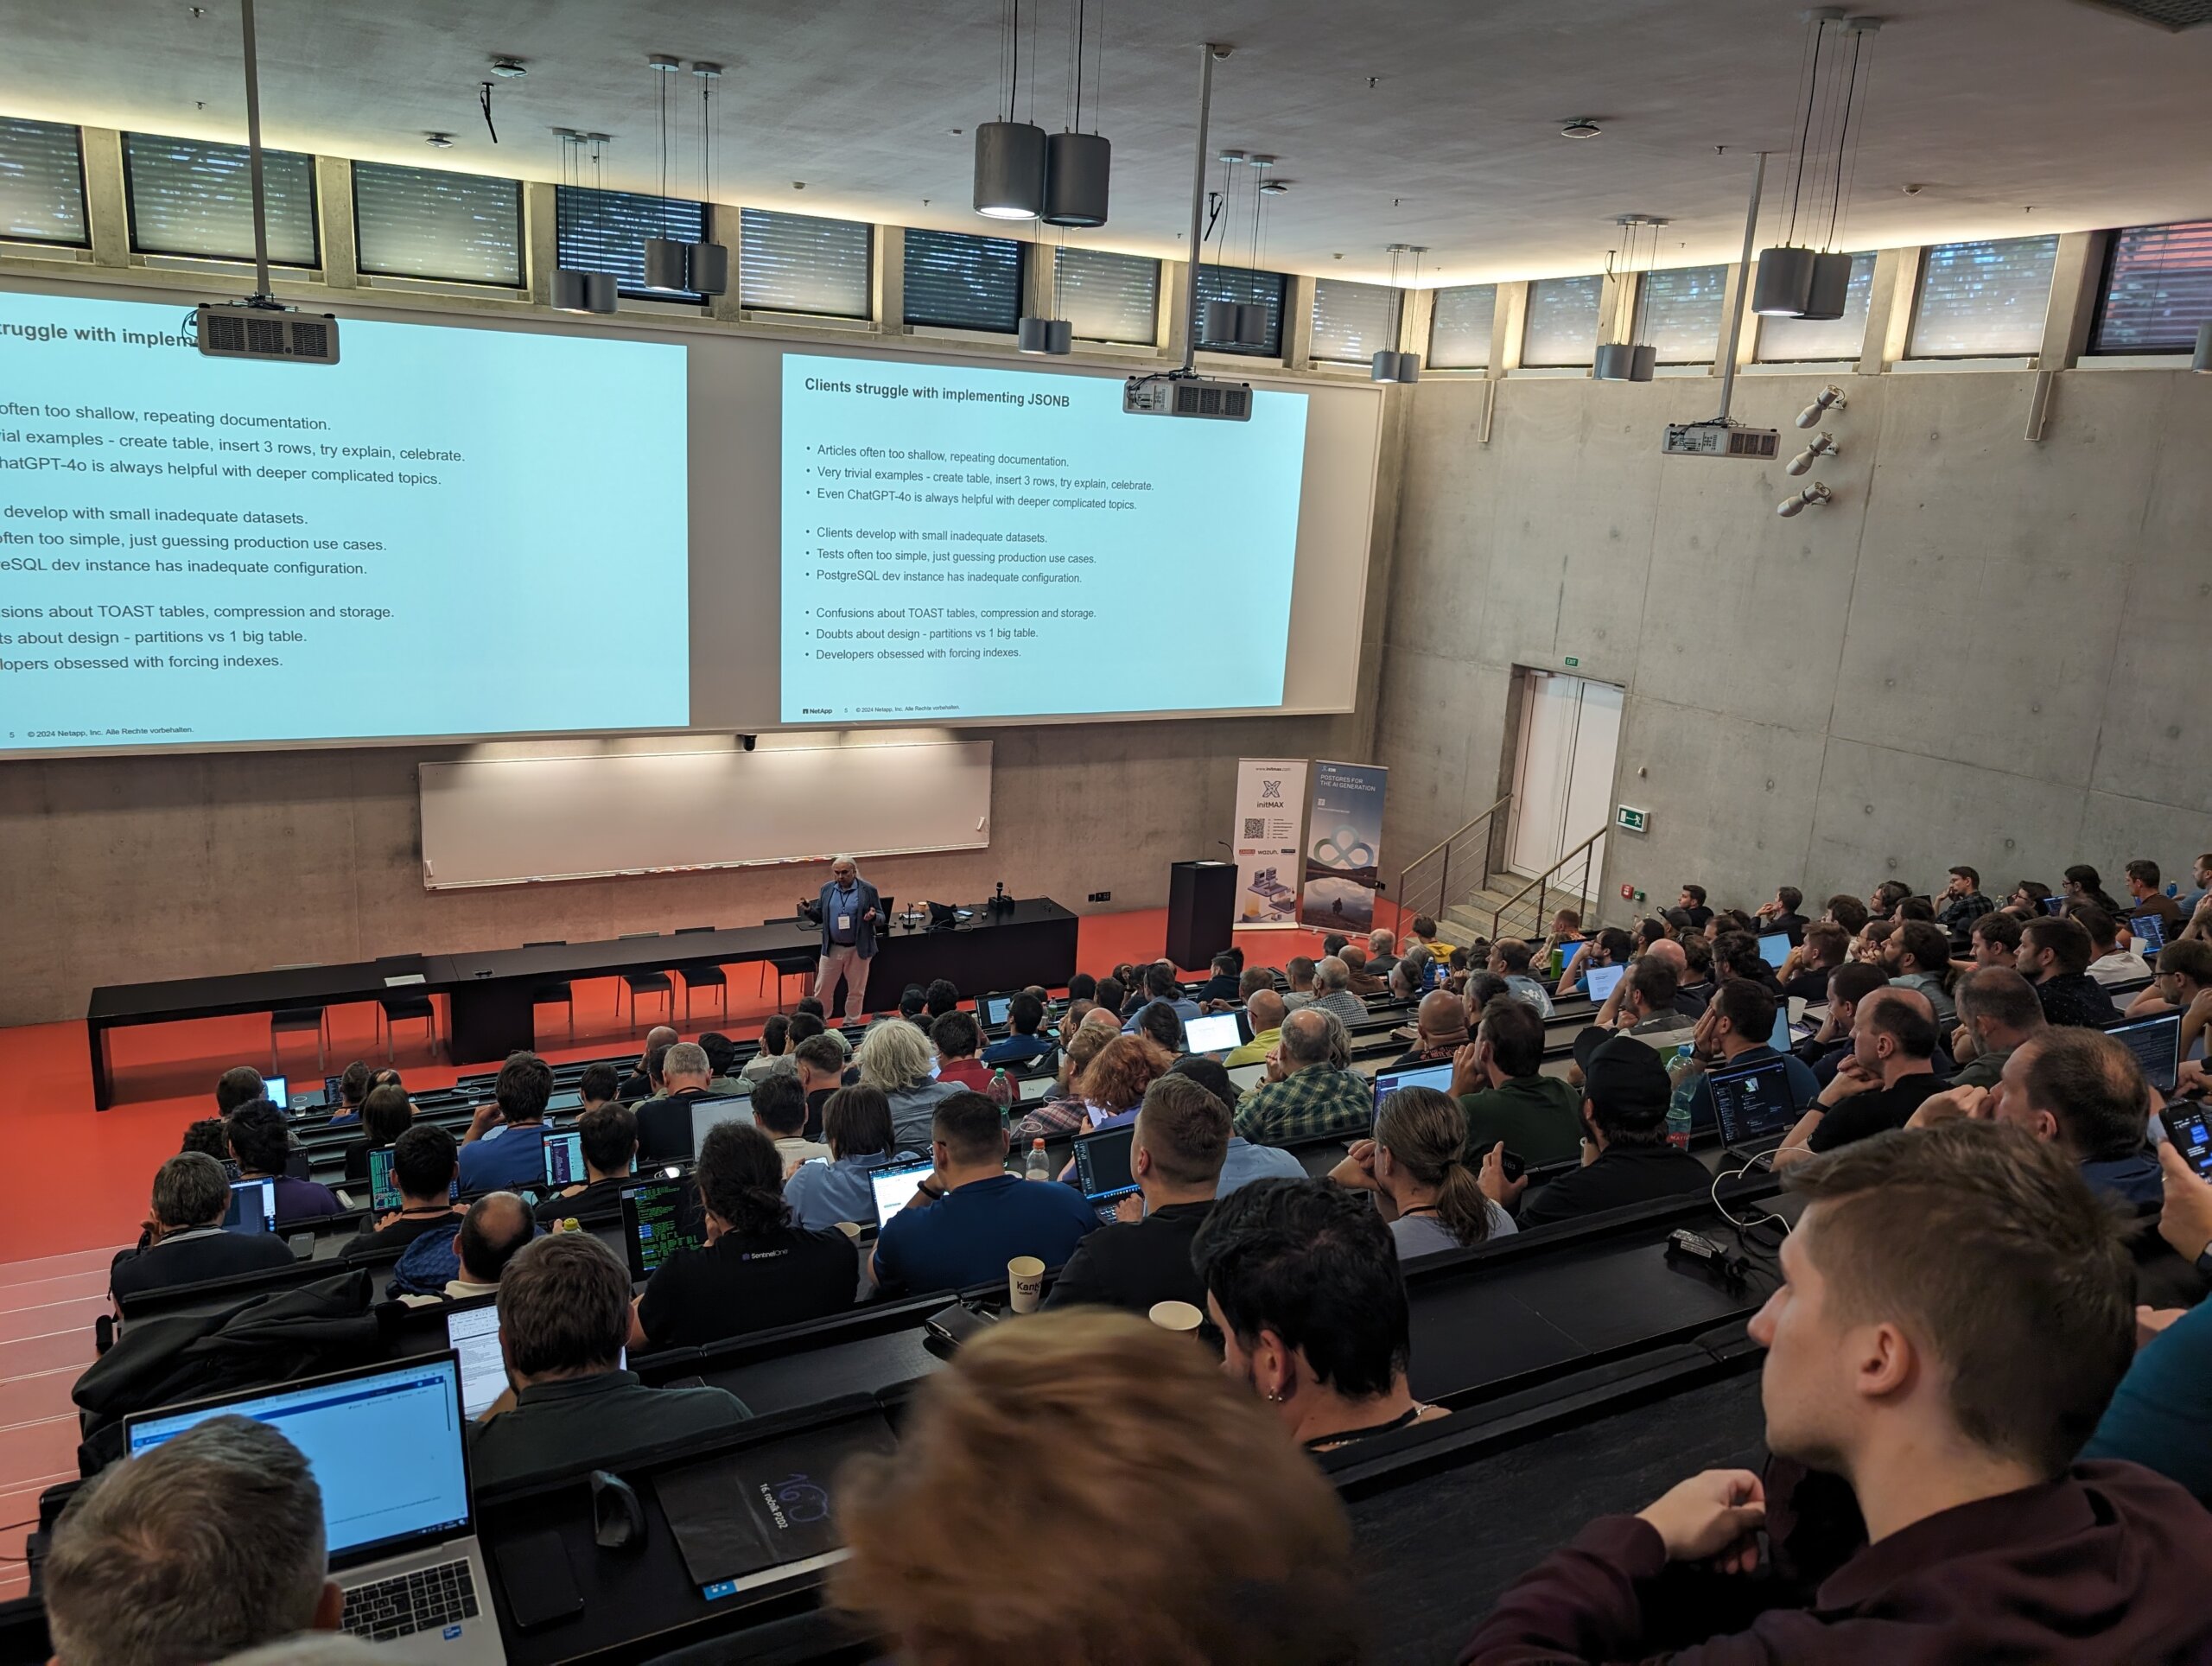
During the conference, I presented my talk, “GIN, BTREE_GIN, GIST, and BTREE Indexes on JSONB Data.” This talk summarized the current findings of my project at NetApp (credativ), which I initiated to deepen our understanding of these indexing methods and their performance results. Our goal is to provide relevant and valuable solutions to our customers, who often struggle with implementing JSONB columns and operations into their applications and find the available information insufficient. Even existing AI models fall short as they rely on the same limited publicly available data. The project is focused on JSONB data; however, the results have already shown applicability beyond just this type of data. The positive reactions from the audience indicated that my presentation was well-received. The conference is a bilingual event, with presentations in both Czech and English. Being from Czechia, I delivered my talk in Czech but used English slides.
The conference also featured seven other insightful talks throughout the day. The first talk by Jan Karremans from Cybertec delved into the CloudNativePG operator, which implements PostgreSQL to run on Kubernetes. The second talk by Jakub Zemanek from initMax provided a detailed guide on configuring PostgreSQL accounts based on Active Directory using Ansible and the ldap2pg program. Gülçin Yıldırım Jelínek from EDB followed with a practical example of implementing vector storage of AI embeddings in PostgreSQL. I also really enjoyed the engaging and informative talk by Boriss Mejias from EDB, who explained different types of consistency and ways to ensure them in PostgreSQL using synchronous or asynchronous replication, and colored his talk with practical examples from a big musical event, where payments from multiple sources must be quickly and safely distributed throughout the system. Pavel Stehule offered a deep analysis of the pros and cons of the existing cost-based optimizer in PostgreSQL (slides in Czech lang). Pavlo Golub from Cybertec delivered an informative session on programming different PostgreSQL operations with the Go language. In the final talk, Ales Zeleny presented an in-depth analysis of the features of two extensions focused on monitoring query performance in PostgreSQL – pg_stat_statements and pg_stat_monitor.
The conference was really well-organized, and I extend my gratitude to Tomas Vondra and the other organizers for their hard work. Overall, it was very successful event, filled with valuable insights, engaging discussions, and networking opportunities. I look forward to applying the knowledge gained here and I am eager for future editions of the P2D2 conference.
Useful links:
- Prague PostgreSQL Developer Day 2024 talks – summaries with links to slides (English / Czech)
- Prague PostgreSQL Developer Day 2024 conference recap – Tomas Vondra (English)
Photos by Tomas Vondra (EDB):
Overview
Tables that are created and dropped on demand, whether they are temporary or regular, are frequently used by application developers in PostgreSQL to simplify the implementation of various functionalities and to expedite responses. Numerous articles on the internet describe the advantages of using such tables for storing search results, precalculating figures for reports, importing data from external files, and more. One can even define a TEMP TABLE with the condition ON COMMIT DROP, allowing the system to clean up automatically. However, like most things, this solution has potential drawbacks, because size matters. A solution that functions smoothly for dozens of parallel sessions may suddenly begin to cause unexpected issues if the application is used by hundreds or thousands of users simultaneously during peak hours. Frequently creating and dropping tables and related objects, can cause significant bloat of certain PostgreSQL system tables. This is a well-known problem that many articles mention, but they often lack detailed explanations and quantification of the impact. Several pg_catalog system tables can become significantly bloated. Table pg_attribute is the most affected, followed by pg_attrdef and pg_class.
What is the main issue with the bloating of system tables?
We already encountered this issue in the PostgreSQL logs of one of our clients. When the bloat of system tables became too extensive, PostgreSQL decided to reclaim free space during an autovacuum operation. This action caused exclusive locks on the table and blocked all other operations for several seconds. PostgreSQL was unable to read information about the structures of all relations. And as a result, even the simplest select operations had to be delayed until the operation was resolved. This is, of course, an extreme and rare scenario that can only occur under exceptionally high load. Nevertheless, it’s important to be aware of it and be able to assess if it could also happen to our database.
Example of reporting table in accounting software
CREATE TEMP TABLE pivot_temp_table (
   id serial PRIMARY KEY,
   inserted_at timestamp DEFAULT current_timestamp,
   client_id INTEGER,
   name text NOT NULL,
   address text NOT NULL,
   loyalty_program BOOLEAN DEFAULT false,
   loyalty_program_start TIMESTAMP,
   orders_202301_count_of_orders INTEGER DEFAULT 0,
   orders_202301_total_price NUMERIC DEFAULT 0,
   ...
   orders_202312_count_of_orders INTEGER DEFAULT 0,
   orders_202312_total_price NUMERIC DEFAULT 0);
CREATE INDEX pivot_temp_table_idx1 ON pivot_temp_table (client_id);
CREATE INDEX pivot_temp_table_idx2 ON pivot_temp_table (name);
CREATE INDEX pivot_temp_table_idx3 ON pivot_temp_table (loyalty_program);
CREATE INDEX pivot_temp_table_idx4 ON pivot_temp_table (loyalty_program_start);
- A temporary table, pivot_temp_table, with 31 columns, 27 of which have default values.
- Some of the columns are of the TEXT data type, resulting in the automatic creation of a TOAST table.
- The TOAST table requires an index on chunk_id and chunk_seq.
- The ID is the primary key, meaning a unique index on ID was automatically created.
- The ID is defined as SERIAL, leading to the automatic creation of a sequence, which is essentially another table with a special structure.
- We also defined four additional indexes on our temporary table.
Let’s now examine how these relations are represented in PostgreSQL system tables.
Table pg_attribute
- Each row in our pivot_temp_table contains six hidden columns (tableoid, cmax, xmax, cmin, xmin, ctid) and 31 ‘normal’ column. This totals to 37 rows inserted for the main temp table.
- Indexes will add one row for each column used in the index, equating to five rows in our case.
- A TOAST table was automatically created. It has six hidden columns and three normal columns (chunk_id, chunk_seq, chunk_data), and one index on chunk_id and chunk_seq, adding up to 11 rows in total.
- A sequence for the ID was created, which is essentially another table with a predefined structure. It has six hidden columns and three normal columns (last_value, log_cnt, is_called), adding another nine rows.
Table pg_attrdef
SELECT
   c.relname as table_name,
   o.rolname as table_owner,
   c.relkind as table_type,
   a.attname as column_name,
   a.attnum as column_number,
   a.atttypid::regtype as column_data_type,
   pg_get_expr(adbin, adrelid) as sql_command
FROM pg_attrdef ad
JOIN pg_attribute a ON ad.adrelid = a.attrelid AND ad.adnum = a.attnum
JOIN pg_class c ON c.oid = ad.adrelid
JOIN pg_authid o ON o.oid = c.relowner
WHERE c.relname = 'pivot_temp_table'
ORDER BY table_name, column_number;
    table_name    | table_owner | table_type |         column_name           | column_number |     column_data_type        | sql_command
------------------+-------------+------------+-------------------------------+---------------+-----------------------------+----------------------------------------------
 pivot_temp_table | postgres    | r          | id                            | 1             | integer                     | nextval('pivot_temp_table_id_seq'::regclass)
 pivot_temp_table | postgres    | r          | inserted_at                   | 2             | timestamp without time zone | CURRENT_TIMESTAMP
 pivot_temp_table | postgres    | r          | loyalty_program               | 6             | boolean                     | false
 pivot_temp_table | postgres    | r          | orders_202301_count_of_orders | 8             | integer                     | 0
 pivot_temp_table | postgres    | r          | orders_202301_total_price     | 9             | numeric                     | 0
--> up to the column "orders_202312_total_price"
Table pg_class
The pg_class table stores primary information about relations. This example will create nine rows: one for the temp table, one for the toast table, one for the toast table index, one for the ID primary key unique index, one for the sequence, and four for the custom indexes.
Summary of this example
Our first example produced a seemingly small number of rows – 62 in pg_attribute, 27 in pg_attrdef, and 9 in pg_class. These are very low numbers, and if such a solution was used by only one company, we would hardly see any problems. But consider a scenario where a company hosts accounting software for small businesses and hundreds or even thousands of users use the app during peak hours. In such a situation, many temp tables and related objects would be created and dropped at a relatively quick pace. In the pg_attribute table, we could see anywhere from a few thousand to even hundreds of thousands of records inserted and then deleted over several hours. However, this is still a relatively small use case. Let’s now imagine and benchmark something even larger.
Example of online shop
- The “session_events” table stores selected actions performed by the user during the session. Events are collected for each action the user takes on the website, so there are at least hundreds, but more often thousands of events recorded from one session. These are all sent in parallel into the main event table. However, the main table is enormous. Therefore, this user-specific table stores only some events, allowing for quick analysis of recent activities, etc. The table has 25 different columns, some of which are of the TEXT type and one column of the JSONB type – which means a TOAST table with one index was created. The table has a primary key of the serial type, indicating the order of actions – i.e., one unique index, one sequence, and one default value were created. There are no additional default values. The table also has three additional indexes for quicker access, each on one column. Their benefit could be questionable, but they are part of the implementation.
- Summary of rows in system tables – pg_attribute – 55 rows, pg_class – 8 rows, pg_attrdef – 1 row
- The “last_visited” table stores a small subset of events from the “session_events” table to quickly show which articles the user has visited during this session. Developers chose to implement it this way for convenience. The table is small, containing only 10 columns, but at least one is of the TEXT type. Therefore, a TOAST table with one index was created. The table has a primary key of the TIMESTAMP type, therefore it has one unique index, one default value, but no sequence. There are no additional indexes.
- Rows in system tables – pg_attribute – 28 rows, pg_class – 4 rows, pg_attrdef – 1 row
- The “last_purchases” table is populated at login from the main table that stores all purchases. This user-specific table contains the last 50 items purchased by the user in previous sessions and is used by the recommendation algorithm. This table contains fully denormalized data to simplify their processing and visualization, and therefore it has 35 columns. Many of these columns are of the TEXT type, so a TOAST table with one index was created. The primary key of this table is a combination of the purchase timestamp and the ordinal number of the item in the order, leading to the creation of one unique index but no default values or sequences. Over time, the developer created four indexes on this table for different sorting purposes, each on one column. The value of these indexes can be questioned, but they still exist.
- Rows in system tables – pg_attribute – 57 rows, pg_class – 8 rows
- The “selected_but_not_purchased” table is populated at login from the corresponding main table. It displays the last 50 items still available in the shop that the user previously considered purchasing but later removed from the cart or didn’t finish ordering at all, and the content of the cart expired. This table is used by the recommendation algorithm and has proven to be a successful addition to the marketing strategy, increasing purchases by a certain percentage. The table has the same structure and related objects as “last_purchases”. Data are stored separately from purchases to avoid mistakes in data interpretation and also because this part of the algorithm was implemented much later.
- Rows in system tables – pg_attribute – 57 rows, pg_class – 8 rows
- The “cart_items” table stores items selected for purchase in the current session but not yet bought. This table is synchronized with the main table, but a local copy in the session is also maintained. The table contains normalized data, therefore it has only 15 columns, some of which are of the TEXT type, leading to the creation of a TOAST table with one index. It has a primary key ID of the UUID type to avoid collisions across all users, resulting in the creation of one unique index and one default value, but no sequence. There are no additional indexes.
- Rows in system tables – pg_attribute – 33 rows, pg_class – 4 rows, pg_attrdef – 1 row
The creation of all these user-specific tables results in the insertion of the following number of rows into PostgreSQL system tables – pg_attribute: 173 rows, pg_class: 32 rows, pg_attrdef: 3 rows.
Analysis of traffic
As the first step we provide an analysis of the business use case and traffic seasonality. Let’s imagine our retailer is active in several EU countries and targets mainly people from 15 to 35 years old. The online shop is relatively new, so it currently has 100,000 accounts. Based on white papers available on the internet, we can presume the following user activity:
| Level of user’s activity | Ratio of users [%] | Total count of users | Frequency of visits on page |
|---|---|---|---|
| very active | 10% | 10,000 | 2x to 4x per week |
| normal activity | 30% | 30,000 | ~1 time per week |
| low activity | 40% | 40,000 | 1x to 2x per month |
| almost no activity | 20% | 20,000 | few times in year |
Since this is an online shop, traffic is highly seasonal. Items are primarily purchased by individuals for personal use. Therefore, during the working day, they check the shop at very specific moments, such as during travel or lunchtime. The main peak in traffic during the working day is between 7pm and 9pm. Fridays usually have much lower traffic, and the weekend follows suit. The busiest days are generally at the end of the month, when people receive their salaries. The shop experiences the heaviest traffic on Thanksgiving Thursday and Black Friday. The usual practice in recent years is to close the shop for an hour or two and then reopen at a specific hour with reduced prices. Which translates into huge number of relations being created and later deleted at relatively short time. The duration of a user’s connection can range from just a few minutes up to half an hour. User-specific tables are created when user logs into shop. They are later deleted by a special process that uses a sophisticated algorithm to determine whether relations already expired or not. This process involves various criteria and runs at distinct intervals, so we can see a large number of relations deleted in one run. Let’s quantify these descriptions:
| Traffic on different days | Logins per 30 min | pg_attribute [rows] | pg_class [rows] | pg_attrdef [rows] |
|---|---|---|---|---|
| Numbers from analysis per 1 user | 1 | 173 | 32 | 3 |
| Average traffic in the afternoon | 1,000 | 173,000 | 32,000 | 3,000 |
| Normal working day evening top traffic | 3,000 | 519,000 | 96,000 | 9,000 |
| Evening after salary low traffic | 8,000 | 1,384,000 | 256,000 | 24,000 |
| Evening after salary high traffic | 15,000 | 2,595,000 | 480,000 | 45,000 |
| Singles’ Day evening opening | 40,000 | 6,920,000 | 1,280,000 | 120,000 |
| Thanksgiving Thursday evening opening | 60,000 | 10,380,000 | 1,920,000 | 180,000 |
| Black Friday evening opening | 50,000 | 8,650,000 | 1,600,000 | 150,000 |
| Black Friday weekend highest traffic | 20,000 | 3,460,000 | 640,000 | 60,000 |
| Theoretical maximum – all users connected | 100,000 | 17,300,000 | 3,200,000 | 300,000 |
Now we can see what scalability means. Our solution will definitely work reasonably on normal days. However, traffic in the evenings after people receive their salaries can be very heavy. Thanksgiving Thursday and Black Friday really test its limits. Between 1 and 2 million user-specific tables and related objects will be created and deleted during these evenings. And what happens if our shop becomes even more successful and the number of accounts grows to 500 000, 1 million or more? The solution would definitely hit the limits of vertical scaling at some points, and we would need to think about ways to scale it horizontally.
How to examine bloat
WITH tablenames AS (SELECT tablename FROM (VALUES('pg_attribute'),('pg_attrdef'),('pg_class')) as t(tablename))
SELECT
   tablename,
   now() as checked_at,
   pg_relation_size(tablename) as relation_size,
   pg_relation_size(tablename) / (8*1024) as relation_pages,
   a.*,
   s.*
FROM tablenames t
JOIN LATERAL (SELECT * FROM pgstattuple(t.tablename)) s ON true
JOIN LATERAL (SELECT last_autovacuum, last_vacuum, last_autoanalyze, last_analyze, n_live_tup, n_dead_tup
FROM pg_stat_all_tables WHERE relname = t.tablename) a ON true
ORDER BY tablenametablename | pg_attribute checked_at | 2024-02-18 10:46:34.348105+00 relation_size | 44949504 relation_pages | 5487 last_autovacuum | 2024-02-16 20:07:15.7767+00 last_vacuum | 2024-02-16 20:55:50.685706+00 last_autoanalyze | 2024-02-16 20:07:15.798466+00 last_analyze | 2024-02-17 22:05:43.19133+00 n_live_tup | 3401 n_dead_tup | 188221 table_len | 44949504 tuple_count | 3401 tuple_len | 476732 tuple_percent | 1.06 dead_tuple_count | 107576 dead_tuple_len | 15060640 dead_tuple_percent| 33.51 free_space | 28038420 free_percent | 62.38
WITH pages AS (
   SELECT * FROM generate_series(0, (SELECT pg_relation_size('pg_attribute') / 8192) -1) as pagenum),
tuples_per_page AS (
   SELECT pagenum, nullif(sum((t_xmin is not null)::int), 0) as tuples_per_page
   FROM pages JOIN LATERAL (SELECT * FROM heap_page_items(get_raw_page('pg_attribute',pagenum))) a ON true
   GROUP BY pagenum)
SELECT
   count(*) as pages_total,
   min(tuples_per_page) as min_tuples_per_page,
   max(tuples_per_page) as max_tuples_per_page,
   round(avg(tuples_per_page),0) as avg_tuples_per_page,
   mode() within group (order by tuples_per_page) as mode_tuples_per_page
FROM tuples_per_pagepages_total | 5487 min_tuples_per_page | 1 max_tuples_per_page | 55 avg_tuples_per_page | 23 mode_tuples_per_page | 28
Here, we can see that in our pg_attribute system table, we have an average of 23 tuples per page. So now we can calculate theoretical increase in size of this table for different traffic. Typical size of this table is usually only few hundreds of MBs. So theoretical bloat about 3 GB during Black Friday days is quite significant number for this table.
| Logins | pg_attribute rows | data pages | size in MB |
|---|---|---|---|
| 1 | 173 | 8 | 0.06 |
| 1,000 | 173,000 | 7,522 | 58.77 |
| 3,000 | 519,000 | 22,566 | 176.30 |
| 15,000 | 2,595,000 | 112,827 | 881.46 |
| 20,000 | 3,460,000 | 150,435 | 1,175.27 |
| 60,000 | 10,380,000 | 451,305 | 3,525.82 |
| 100,000 | 17,300,000 | 752,174 | 5,876.36 |
Summary
We’ve presented a reporting example from accounting software and an example of user-specific tables from an online shop. While both are theoretical, the idea is to illustrate patterns. We also discussed the influence of high traffic seasonality on the number of inserts and deletes in system tables. We provided an example of an extremely increased load in an online shop on big sales days. We believe the results of the analysis warrant attention. It’s also important to remember that the already heavy situation in these peak moments can be even more challenging if our application is running on an instance with low disk IOPS. All these new objects would cause writes into WAL logs and synchronization to the disk. In the case of low disk throughput, there could be significant latency, and many operations could be substantially delayed. So, what’s the takeaway from this story? First of all, PostgreSQL autovacuum processes are designed to minimize the impact on the system. If the autovacuum settings on our database are well-tuned, in most cases, we won’t see any problems. However, if these settings are outdated, tailored for much lower traffic, and our system is under unusually heavy load for an extended period, creating and dropping thousands of tables and related objects in a relatively short time, PostgreSQL system tables can eventually become significantly bloated. This will already slow down system queries reading details about all other relations. And at some point, the system could decide to shrink these system tables, causing an Exclusive lock on some of these relations for seconds or even dozens of seconds. This could block a large number of selects and other operations on all tables. Based on analysis of traffic, we can conduct a similar analysis for other specific systems to understand when they will be most susceptible to such incidents. But having effective monitoring is absolutely essential.
Resources
The PostgreSQL 2024Q1 back-branch releases 16.2, 15.6, 14.11, 13.14 and 12.18 on February 8th 2024. Besides fixing a security issue (CVE-2024-0985) and the usual bugs, they are somewhat unique in that they address two performance problems by backporting fixes already introduced into the master branch before. In this blog post, we describe two quick benchmarks that show how the new point releases have improved. The benchmarks were done on a ThinkPad T14s Gen 3 which has a Intel i7-1280P CPU with 20 cores and 32 GB of RAM.
Scalability Improvements During Heavy Contention
The performance improvements in the 2024Q1 point releases concerns locking scalability improvements at high client counts, i.e., when the system is under heavy contention. Benchmarks had shown that the performance was getting worse dramatically for a pgbench run with more than 128 clients. The original commit to master (which subsequently was released with version 16) is from November 2022. It got introduced into the back-branches now as version 16 has seen some testing and the results were promising.
The benchmark we used is adapted from this post by the patch author and consists of a tight pgbench run simply executing SELECT txid_current() for five seconds each at increasing client count and measuring the transactions per second:
$ cat /tmp/txid.sql
SELECT txid_current();
$ for c in 1 2 4 8 16 32 64 96 128 192 256 384 512 768 1024 1536;
> do echo -n "$c ";pgbench -n -M prepared -f /tmp/txid.sql -c$c -j$c -T5 2>&1|grep '^tps'|awk '{print $3}';
> done
The following graph shows the average transactions per second (tps) over 3 runs with increasing client count (1-1536 clients), using the Debian 12 packages for version 15, comparing the 2023Q4 release (15.5, package postgresql-15_15.5-0+deb12u1) with the 2024Q1 release (15.6, package postgresql-15_15.6-0+deb12u1):
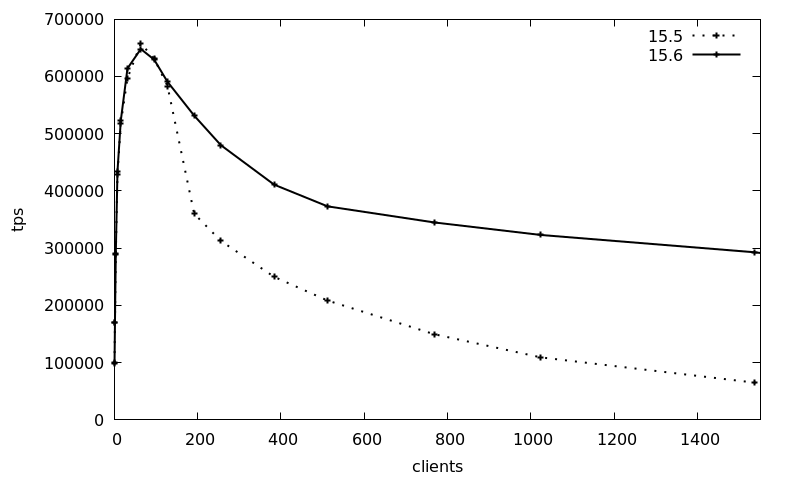
The tps numbers are basically the same up to 128 clients, whereas afterwards the 15.5 transaction counts drops from the peak of 650k 10-fold to 65k. The new 15.6 release maintains the transaction count much better and still maintains around 300k tps at the 1536 clients, which is a 4.5-fold increase of the 2024Q1 release compared to previously.
This benchmark is of course a best-case, artificial scenario, but it shows that the latest point release of Postgres can improve scalability dramatically for heavily contested locking scenarios.
JIT Memory Consumption Improvements
JIT (just-in-time compilation with LLVM) was introduced in version 11 of Postgres and made the default in version 13. For a long time now, it has been known that long-running PostgreSQL sessions that run JIT queries repeatedly leak memory. There have been several bug reports about this, including some more in the Debian bug tracker and probably elsewhere.
This has been diagnosed to be due to JIT inlining and a work-around is setting jit_inline_above_cost to -1 from the default value of 500000. However, this disables JIT inlining completely. The 2024Q1 back-branch releases contain a backport of a change that will go into version 17: after every 100 queries, the LLVM caches are dropped and recreated, plugging the memory leak.
To show how the memory consumption has improved, we use the test case from this bug report. The benchmark is prepared as followed:
CREATE TABLE IF NOT EXISTS public.leak_test
(
   id integer NOT NULL,
   CONSTRAINT leak_test_pkey PRIMARY KEY (id)
);

INSERT INTO leak_test(id)
   SELECT id
   FROM generate_series(1,100000) id
ON CONFLICT DO NOTHING;
Then, the process ID of the backend is noted and the SQL query mentioned in the bug report run 5000 times in a loop:
=> SELECT pg_backend_pid();
 pg_backend_pid
----------------
         623404

=> DO $$DECLARE loop_cnt integer;
-> BEGIN
->   loop_cnt := 5000;
->   LOOP
->     PERFORM
->       id,
->       (SELECT count(*) FROM leak_test x WHERE x.id=l.id) as x_result,
->       (SELECT count(*) FROM leak_test y WHERE y.id=l.id) as y_result
->       /* Leaks memory around 80 kB on each query, but only if two sub-queries are used. */
->     FROM leak_test l;
->     loop_cnt := loop_cnt - 1;
->     EXIT WHEN loop_cnt = 0;
->   END LOOP;
-> END$$;
During this the memory consumption of the Postgres backend is recorded via pidstat:
pidstat -r -hl -p 623404 2 | tee -a leak_test.log.15.6
Linux 6.1.0-18-amd64 (mbanck-lin-0.credativ.de)     15.02.2024  _x86_64_    (20 CPU)

# Time        UID       PID  minflt/s  majflt/s     VSZ     RSS   %MEM  Command
12:48:56      118    623404      0,00      0,00  381856   91504   0,28  postgres: 15/main: postgres postgres [local] SELECT
12:48:58      118    623404      0,00      0,00  381856   91504   0,28  postgres: 15/main: postgres postgres [local] SELECT
12:49:00      118    623404      0,00      0,00  381856   91504   0,28  postgres: 15/main: postgres postgres [local] SELECT
12:49:02      118    623404      0,00      0,00  381856   91504   0,28  postgres: 15/main: postgres postgres [local] SELECT
12:49:04      118    623404   7113,00      0,00  393632  109252   0,34  postgres: 15/main: postgres postgres [local] SELECT
12:49:06      118    623404  13219,00      0,00  394556  109508   0,34  postgres: 15/main: postgres postgres [local] SELECT
12:49:08      118    623404  14376,00      0,00  395384  108228   0,33  postgres: 15/main: postgres postgres [local] SELECT
[...]
The benchmark are again repeated for the 15.5 and 15.6 Debian 12 packages (which are both linked against LLVM-14) and the RSS memory consumption as reported by pidstat is plotted against time:
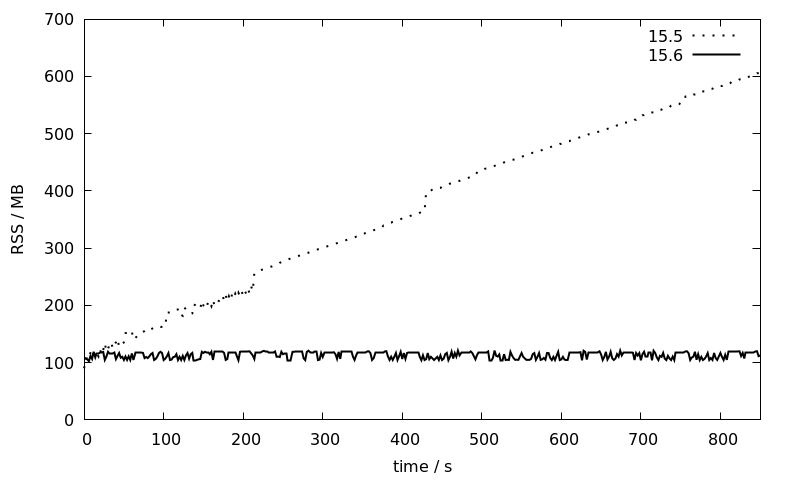
While the memory consumption of the 15.5 session increases linearly over time from 100 to 600 MB, it stays more or less constant at around 100 MB for 15.6. This is a great improvement that will make JIT much more usable for larger installations with long running sessions where so far the usual recommendation has been to disable JIT entirely.
Conclusion
The 2024Q1 patch release has important performance improvements for lock scalability and JIT memory consumption that we have demonstrated in this blog post. Furthermore, the patch release contains other important bug fixes and a security fix for CVE-2024-0985. This security issue is limited to materialized views and a admin user needs to be tricked into recreating a malicious materialized view on behalf of an attacker. But it has seen some german press coverage so quite a few of our customers were especially made aware of it and asked us to assist them with their minor upgrades. In general, Postgres patch releases are low-risk and unintrusive (just install the updated packages and restart the Postgres instances if the package did not do this itself) so that they should always be deployed as soon as possible.
