There are two ways to authenticate yourself as a client to Icinga2. On the one hand there is the possibility to authenticate yourself by username and password. The other option is authentication using client certificates. With the automated query of the Icinga2 API, the setup of client certificates is not only safety-technically advantageous, but also in the implementation on the client side much more practical.
Unfortunately, the official Icinga2 documentation does not provide a description of the exact certificate creation process. Therefore here is a short manual:
After installing Icinga2 the API feature has to be activated first:
icinga2 feature enable api
The next step is to configure the Icinga2-node as master, the easiest way to do this is with the “node-wizard” program:
icinga2 node wizard
Icinga2 creates the necessary CA certificates with which the client certificates still to be created must be signed. Now the client certificate is created:
icinga2 pki new-cert --cn --key .key --csr .csr
The parameter cn stands for the so-called common-name. This is the name used in the Icinga2 user configuration to assign the user certificate to the user. Usually the common name is the FQDN. In this scenario, however, this name is freely selectable. All other names can also be freely chosen, but it is recommended to use a name that suggests that the three files belong together.
Now the certificate has to be signed by the CA, Icinga2:
icinga2 pki sign-csr --csr .csr --cert .crt
Finally, the API user must be created in the file “api-user.conf”. This file is located in the subfolder of each Icinga2 configuration:
object ApiUser {
client_cn =
permissions = []
}
For a detailed explanation of the user’s assignment of rights, it is worth taking a look at the documentation.
Last but not least Icinga2 has to be restarted. Then the user can access the Icinga2 API without entering a username and password, if he passes the certificates during the query.
You can read up on the services we provide for Icinga2 righthere.
This post was originally written by Bernd Borowski.
The migration of IT landscapes to cloud environments is common today. However, the question often remains how to monitor these newly created infrastructures and react to failures. For traditional infrastructure, monitoring tools such as Icinga are used. These tools are often deployed using configuration management methods, such as Ansible or Puppet.
In cloud environments, this is somewhat different. On the one hand, virtual machines are certainly used here, where these methods would be applicable. On the other hand, modern cloud environments also thrive on abstracting away from the virtual machine and offering services, for example as SaaS, in a decoupled manner. But how does one monitor such services?
Manual configuration of an Icinga2 monitoring system is not advisable, as these cloud environments, in particular, are characterized by high dynamism. The risk of not monitoring a service that was quickly added but later becomes important is high.
The Icinga2 and IcingaWeb2 project responded to these requirements for dynamic monitoring environments some time ago with the Director plugin. The Director plugin, using so-called importer modules, is capable of dynamically reading resources contained in various environments, such as “VMware VSphere” or “Amazon AWS“. These can then be automatically integrated into classic Icinga monitoring via rules.
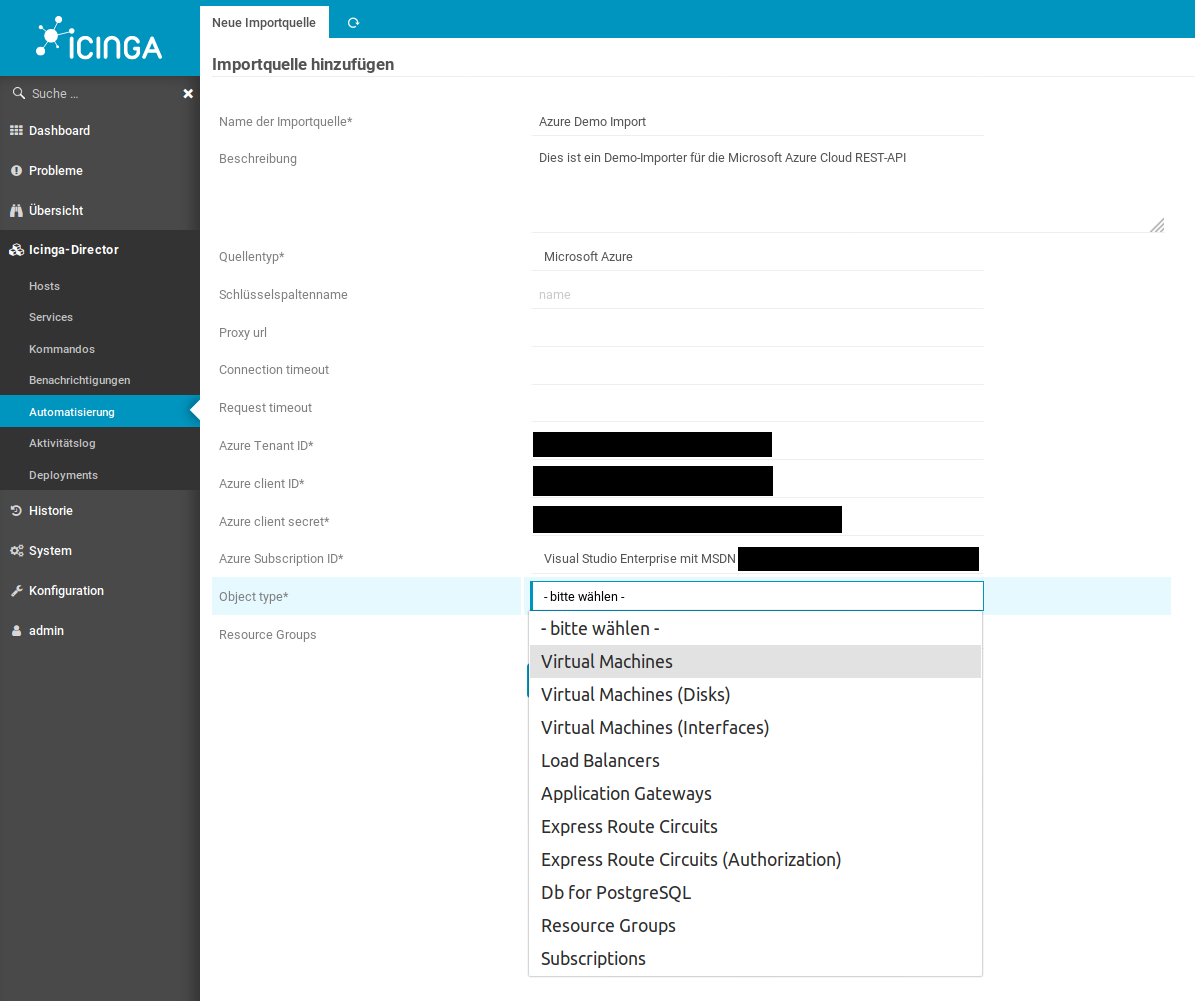
Sponsored by DPD Deutschland GmbH, credativ GmbH is developing an extension module for the IcingaWeb2 Director, which allows dynamic integration of resources from the “Microsoft Azure Cloud“. This module queries the Microsoft Azure REST API and returns various resource types, which can then be automatically added to your monitoring via the Director. The module is already in use by our customers and will be further developed according to demand.
Ten resource types are already supported
Currently, the Azure Importer Module supports the following resource types:
- Virtual Machines
- Virtual Disks
- Network Interfaces for Virtual Machines
- Load Balancers
- Application Gateways
- Microsoft.DBforPostgreSQL® servers (SaaS)
- Express Route Circuits
- Authorizations for Express Route Circuits
- Resource Groups
- Subscriptions
The module is now available as an open source solution
The respective tested versions are available here for download as a release.
Do you require support with monitoring?
Key Takeaways
- The migration of IT landscapes to cloud environments requires effective monitoring.
- The Icinga Director plugin enables the automatic integration of resources from various cloud environments.
- credativ GmbH is developing an Azure Importer Module for IcingaWeb2 that dynamically registers Microsoft Azure resources.
- The module already supports ten different resource types and is available as open source under the MIT license.
- Existing customers of credativ GmbH can quickly request assistance for monitoring support.
In this blog, we describe the integration of Icinga2 into Graphite and Grafana on Debian.
What is Graphite
Graphite stores performance data over a configurable period. Services can send metrics to Graphite via a defined interface, which are then stored in a structured manner for the desired period. Possible examples of such metrics include CPU utilization or web server access numbers. Graphs can now be generated from the various metrics via Graphite’s integrated web interface. This allows us to detect and observe changes in values over different periods. A good example of such a trend analysis is disk space utilization. With the help of a trend graph, it is easy to see at what rate the space requirement is growing and approximately when a storage replacement will be necessary.
What is Grafana
Although Graphite offers its own web interface, it is not particularly attractive or flexible. This is where Grafana steps in.
Grafana is a frontend for various metric storage systems. For example, it supports Graphite, InfluxDB, and OpenTSDB. Grafana offers an intuitive interface for creating representative graphs from metrics. It also has a variety of functions to optimize the appearance and display of graphs. Subsequently, graphs can be grouped into dashboards. Parameterization of graphs is also possible. This also allows you to display only a graph from a specific host.
Installing Icinga2
At this point, only the installation required for Graphite is described. Current versions of Icinga2 packages for Debian can be obtained directly from the Debmon Project. The Debmon Project, run by official Debian package maintainers, provides current versions of various monitoring tools for Debian releases in a timely manner. To integrate these packages, the following commands are required:
# add debmon
cat  <<EOF  >/etc/apt/sources.list.d/debmon.list
deb http://debmon.org/debmon debmon-jessie main
EOF

# add debmon key
wget -O - http://debmon.org/debmon/repo.key 2>/dev/null | apt-key add -

# update repos
apt-get update
Next, we can install Icinga2:
apt-get install icinga2
Installing Graphite and Graphite-Web
After Icinga2 is installed, Graphite and Graphite-web can also be installed.
# install packages for icinga2 and graphite-web and carbon

apt-get install icinga2 graphite-web graphite-carbon libapache2-mod-wsgi apache2
Configuring Icinga2 with Graphite
Icinga2 must be configured to export all collected metrics to Graphite. The Graphite component that receives this data is called “Carbon”. In our example installation, Carbon runs on the same host as Icinga2 and also uses the default port. For this reason, no further configuration of Icinga2 is necessary; it is sufficient to enable the export.
The command does this. icinga2 feature enable graphite
Next, Icinga2 must be restarted: service icinga2 restart
If the Carbon server runs on a different host or a different port, the Icinga2 configuration can be adjusted in the file /etc/icinga2/features-enabled/graphite.conf. Details can be found in the Icinga2 documentation.
If the configuration was successful, a number of files should appear shortly in “/var/lib/graphite/whisper/icinga“. If this is not the case, you should check the Icinga2 log file (located in “/var/log/icinga2/icinga2.log“).
Configuring Graphite-web
Grafana uses Graphite’s web frontend as an interface for the metrics stored by Graphite. For this reason, it is necessary to configure Graphite-web correctly. For performance reasons, we operate Graphite-web as a WSGI module. A number of configuration steps are required for this:
- First, we create a user database for Graphite-web. Since we will not have many users, we use sqlite as the backend for our user data at this point. For this purpose, we execute the following commands, which initialize the user database and assign it to the user under which the web frontend runs:
graphite-manage syncdb
chown _graphite:_graphite /var/lib/graphite/graphite.db
- Next, we activate the WSGI module in Apache:
a2enmod wsgi - For simplicity, the web interface should run in its own virtual host and on its own port. To ensure Apache also listens on this port, we add the line “Listen 8000” to the file “/etc/apache2/ports.conf“.
- The Graphite Debian package already provides an Apache configuration file that we can use for our purposes, with slight modifications.
cp /usr/share/graphite-web/apache2-graphite.conf /etc/apache2/sites-available/graphite.confTo ensure the virtual host also uses port 8000, we must replace the line<VirtualHost *:80>
with
<VirtualHost *:8000>
.
- Then we activate the new virtual host via
a2ensite graphiteand restart Apache:systemctl restart apache2 - Graphite-web should now be accessible at http://YOURIP:8000/. If this is not the case, the Apache log files under “/var/log/apache2/” could provide valuable information.
Configuring Grafana
Grafana is currently not included in Debian. However, the author offers an Apt repository through which Grafana can be installed. Even if the repository refers to Wheezy, the packages also work under Debian Jessie.
The repository is only accessible via HTTPS. For this reason, HTTPS support for apt must first be installed: apt-get install apt-transport-https
Next, the repository can be integrated.
# add repo (package for wheezy works on jessie)
cat  <<EOF  >/etc/apt/sources.list.d/grafana.list
deb https://packagecloud.io/grafana/stable/debian/ wheezy main
EOF

# add key
curl -s https://packagecloud.io/gpg.key | sudo apt-key add -

# update repos
apt-get update
Subsequently, the package can be installed: apt-get install grafana. For Grafana to run, we still need to enable the service systemctl enable grafana-server.service and start it systemctl start grafana-server.
Grafana is now accessible at http://YOURIP:3000/. The default username and password in our example is “admin”. This password should, of course, be replaced with a secure password at the next opportunity.
Next, Grafana must be configured to use Graphite as a data source. For simplicity, the configuration is explained via a screencast.
You are currently viewing a placeholder content from Default. To access the actual content, click the button below. Please note that doing so will share data with third-party providers.
After successfully integrating Graphite as a data source, we can create our first graph. There is also a short screencast for this here.
You are currently viewing a placeholder content from Default. To access the actual content, click the button below. Please note that doing so will share data with third-party providers.
Congratulations, you have now successfully installed and configured Icinga2, Graphite, and Grafana. For all further steps, please refer to the documentation of the respective projects: