PostgreSQL 18 made one very important change – data block checksums are now enabled by default for new clusters at cluster initialization time. I already wrote about it in my previous article. I also mentioned that there are still many existing PostgreSQL installations without data checksums enabled, because this was the default in previous versions. In those installations, data corruption can sometimes cause mysterious errors and prevent normal operational functioning. In this post, I want to dissect common PostgreSQL data corruption modes, to show how to diagnose them, and sketch how to recover from them.
Corruption in PostgreSQL relations without data checksums surfaces as low-level errors like “invalid page in block xxx”, transaction ID errors, TOAST chunk inconsistencies, or even backend crashes. Unfortunately, some backup strategies can mask the corruption. If the cluster does not use checksums, then tools like pg_basebackup, which copy data files as they are, cannot perform any validation of data, so corrupted pages can quietly end up in a base backup. If checksums are enabled, pg_basebackup verifies them by default unless –no-verify-checksums is used. In practice, these low-level errors often become visible only when we directly access the corrupted data. Some data is rarely touched, which means corruption often surfaces only during an attempt to run pg_dump — because pg_dump must read all data.
Typical errors include:
-- invalid page in a table:
pg_dump: error: query failed: ERROR: invalid page in block 0 of relation base/16384/66427
pg_dump: error: query was: SELECT last_value, is_called FROM public.test_table_bytea_id_seq

-- damaged system columns in a tuple:
pg_dump: error: Dumping the contents of table "test_table_bytea" failed: PQgetResult() failed.
pg_dump: error: Error message from server: ERROR: could not access status of transaction 3353862211
DETAIL: Could not open file "pg_xact/0C7E": No such file or directory.
pg_dump: error: The command was: COPY public.test_table_bytea (id, id2, id3, description, data) TO stdout;

-- damaged sequence:
pg_dump: error: query to get data of sequence "test_table_bytea_id2_seq" returned 0 rows (expected 1)

-- memory segmentation fault during pg_dump:
pg_dump: error: Dumping the contents of table "test_table_bytea" failed: PQgetCopyData() failed.
pg_dump: error: Error message from server: server closed the connection unexpectedly
This probably means the server terminated abnormally
before or while processing the request.
pg_dump: error: The command was: COPY public.test_table_bytea (id, id2, id3, description, data) TO stdout;
Note: in such cases, unfortunately pg_dump exits on the first error and does not continue. But we can use a simple script which, in a loop, reads table names from the database and dumps each table separately into a separate file, with redirection of error messages into a table-specific log file. This way we both back up tables which are still intact and find all corrupted objects.
Understanding errors
The fastest way to make sense of those symptoms is to map them back to which part of an 8 KB heap page is damaged. To be able to test it, I created a “corruption simulator” Python script which can surgically damage specific parts of a data block. Using it we can test common corruption modes. We will see how to diagnose each with pageinspect, look if amcheck can help in these cases, and show how to surgically unblock queries with pg_surgery when a single tuple makes an entire table unreadable.
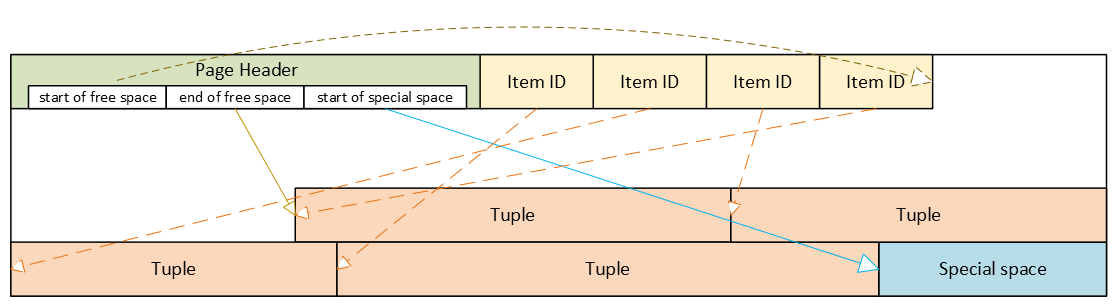
PostgreSQL heap table format
- Header: metadata for block management and integrity
- Item ID (tuple pointer) array: entries pointing to tuples (offset + length + flags)
- Free space
- Tuples: actual row data, each with its own tuple header (system columns)
- Special space: reserved for index-specific or other relation-specific data – heap tables do not use it
Corrupted page header: the whole block becomes inaccessible
The page header contains the layout pointers for the page. The most important fields, which we can also see via pageinspect are:
- pd_flags: header flag bits
- pd_lower: offset to the start of free space
- pd_upper: offset to the end of free space
- pd_special: offset to the start of special space
- plus lsn, checksum, pagesize, version, prune_xid
ERROR: invalid page in block 285 of relation base/16384/29724
This is the only class of corruption error that can be skipped by enabling zero_damaged_pages = on when the cluster does not use data block checksums. With zero_damaged_pages = on, blocks with corrupted headers are “zeroed” in memory and skipped, which literally means the whole content of the block is replaced with zeros. AUTOVACUUM removes zeroed pages, but cannot zero out unscanned pages.
Where the error comes from in PostgreSQL source code
/*
* The following checks don't prove the header is correct, only that
* it looks sane enough to allow into the buffer pool. Later usage of
* the block can still reveal problems, which is why we offer the
* checksum option.
*/

if ((p->pd_flags & ~PD_VALID_FLAG_BITS) == 0 &&
    p->pd_lower <= p->pd_upper &&
    p->pd_upper <= p->pd_special &&
    p->pd_special <= BLCKSZ &&
    p->pd_special == MAXALIGN(p->pd_special))
    header_sane = true;

if (header_sane && !checksum_failure)
    return true;
SELECT * FROM page_header(get_raw_page('pg_toast.pg_toast_32840', 100));

     lsn    | checksum | flags | lower | upper | special | pagesize | version | prune_xid
------------+----------+-------+-------+-------+---------+----------+---------+-----------
0/2B2FCD68 | 0 | 4 | 40 | 64 | 8192 | 8192 | 4 | 0If the header is tested as corrupted, we cannot diagnose anything using SQL. With zero_damaged_pages = off any attempt to read this page ends with an error similar to the example shown above. If we set zero_damaged_pages = on then on the first attempt to read this page everything is replaced with all zeroes, including the header:
SELECT * from page_header(get_raw_page('pg_toast.pg_toast_28740', 578));
WARNING: invalid page in block 578 of relation base/16384/28751; zeroing out page

 lsn | checksum | flags | lower | upper | special | pagesize | version | prune_xid
-----+----------+-------+-------+-------+---------+----------+---------+-----------
 0/0 |        0 |     0 |     0 |     0 |       0 |        0 |       0 |         0
Corrupted Item IDs array: offsets and lengths become nonsense
- ERROR: invalid memory alloc request size 18446744073709551594
- DEBUG: server process (PID 76) was terminated by signal 11: Segmentation fault
SELECT lp, lp_off, lp_flags, lp_len, t_xmin, t_xmax, t_field3, t_ctid, t_infomask2, t_infomask, t_hoff, t_bits, t_oid, substr(t_data::text,1,50) as t_data
FROM heap_page_items(get_raw_page('public.test_table', 7));

 lp | lp_off | lp_flags | lp_len | t_xmin | t_xmax | t_field3 | t_ctid | t_infomask2 | t_infomask | t_hoff | t_bits | t_oid | t_data
----+--------+----------+--------+--------+--------+----------+--------+-------------+------------+--------+--------+-------+----------------------------------------------------
  1 |   7936 |        1 |    252 |  29475 |      0 |        0 |  (7,1) |           5 |       2310 |     24 |        |       | \x01010000010100000101000018030000486f742073656520
  2 |   7696 |        1 |    236 |  29476 |      0 |        0 |  (7,2) |           5 |       2310 |     24 |        |       | \x020100000201000002010000d802000043756c747572616c
  3 |   7504 |        1 |    189 |  29477 |      0 |        0 |  (7,3) |           5 |       2310 |     24 |        |       | \x0301000003010000030100001c020000446f6f7220726563
  4 |   7368 |        1 |    132 |  29478 |      0 |        0 |  (7,4) |           5 |       2310 |     24 |        |       | \x0401000004010000040100009d4d6f76656d656e74207374
Here we can nicely see the Item IDs array – offsets and lengths. The first tuple is stored at the very end of the data block, therefore it has the biggest offset. Each subsequent tuple is stored closer and closer to the beginning of the page, so offsets are getting smaller. We can also see lengths of tuples, they are all different, because they contain a variable-length text value. We can also see tuples and their system columns, but we will look at them later.
Now, when we damage the Item IDs array and diagnose how it looks like – output is shortened because all other columns are empty as well. Due to the damaged Item IDs array, we cannot properly read tuples. Here we can immediately see the problem – offsets and lengths contain random values, the majority of them exceeding 8192, i.e. pointing well beyond data page boundaries:
 lp | lp_off | lp_flags | lp_len | t_xmin | t_xmax
----+--------+----------+--------+--------+--------
  1 |  19543 |        1 |  16226 |        |
  2 |   5585 |        2 |   3798 |        |
  3 |  25664 |        3 |  15332 |        |
  4 |  10285 |        2 |  17420 |        |
SELECT * FROM verify_heapam('test_table', FALSE, FALSE, 'none', 7, 7);

 blkno | offnum | attnum | msg
-------+--------+--------+---------------------------------------------------------------------------
     7 |      1 |        | line pointer to page offset 19543 is not maximally aligned
     7 |      2 |        | line pointer redirection to item at offset 5585 exceeds maximum offset 4
     7 |      4 |        | line pointer redirection to item at offset 10285 exceeds maximum offset 4
Corrupted tuples: system columns can break scans
- 58P01 – could not access status of transaction 3047172894
- XX000 – MultiXactId 1074710815 has not been created yet — apparent wraparound
- WARNING: Concurrent insert in progress within table “test_table”
 lp | lp_off | lp_flags | lp_len |   t_xmin   |   t_xmax   |  t_field3  |       t_ctid       | t_infomask2 | t_infomask | t_hoff | t_bits | t_oid
----+--------+----------+--------+------------+------------+------------+--------------------+-------------+------------+--------+--------+-------
  1 |   6160 |        1 |   2032 | 1491852297 |  287039843 |  491133876 | (3637106980,61186) |       50867 |      46441 |    124 |        |
  2 |   4128 |        1 |   2032 | 3846288155 | 3344221045 | 2002219688 | (2496224126,65391) |       34913 |      32266 |     82 |        |
  3 |   2096 |        1 |   2032 | 1209990178 | 1861759146 | 2010821376 | (426538995,32644)  |       23049 |       2764 |    215 |        |
- XX000 – unexpected chunk number -556107646 (expected 20) for toast value 29611 in pg_toast_29580
- XX000 – found toasted toast chunk for toast value 29707 in pg_toast_29580
Dealing with corrupted tuples using pg_surgery
Even a single corrupted tuple can prevent selects from the entire table. Corruption in xmin, xmax and hint bits will cause a query to fail because the MVCC mechanism will be unable to determine visibility of these damaged tuples. Without data block checksums, we cannot easily zero out such damaged pages, since their header already passed the “sanity” test. We would have to do salvaging row-by-row using a PL/pgSQL script. But if a table is huge and the count of damaged tuples is small, this will be highly impractical.
In such a case, we should think about using the pg_surgery extension to freeze or remove corrupted tuples. But first, the correct identification of damaged tuples is critical, and second, the extension exists since PostgreSQL 14, it is not available in older versions. Its functions require ctid, but we must construct a proper value based on page number and ordinal number of the tuple in the page, we cannot use a damaged ctid from tuple header as shown above.
Freeze vs kill
Frozen tuples are visible to all transactions and stop blocking reads. But they still contain corrupted data: queries will return garbage. Therefore, just freezing corrupted tuples will most likely not help us, and we must kill damaged tuples. But freezing them first might be helpful for making sure we are targeting the proper tuples. Freezing simply means that function heap_force_freeze (with the proper ctid) will replace t_xmin with value 2 (frozen tuple), t_xmax with 0 and will repair t_ctid.
But all other values will stay as they are, i.e. still damaged. Using the pageinspect extension as shown above will confirm we work with a proper tuple. After this check, we can kill damaged tuples using the heap_force_kill function with the same parameters. This function will rewrite the pointer in the Item ID array for this specific tuple and mark it as dead.
Warning — functions in pg_surgery are considered unsafe by definition, so use them with caution. You can call them from SQL like any other function, but they are not MVCC-transactional operations. Their actions are irreversible – ROLLBACK cannot “undo” a freeze or kill, because these functions directly modify a heap page in shared buffers and WAL-log the change. Therefore, we should first test them on a copy of that specific table (if possible) or on some test table. Killing the tuple can also cause inconsistency in indexes, because the tuple does not exist anymore, but it could be referenced in some index. They write changes into the WAL log; therefore, the change will be replicated to standbys.
Summary
 PostgreSQL 17 introduced streaming I/O – grouping multiple page reads into a single system call and using smarter posix_fadvise() hints. That alone gave up to ~30% faster sequential scans in some workloads, but it was still strictly synchronous: each backend process would issue a read and then sit there waiting for the kernel to return data before proceeding. Before PG17, PostgreSQL typically read one 8kB page at a time.
- Heap sequential scans, like plain SELECT and COPY operations that stream lots of data
- VACUUM on big tables and indexes
- ANALYZE sampling
- Bitmap heap scans
Autovacuum benefits from this change too, since its workers share the same VACUUM/ANALYZE code paths. Other operations still remain synchronous for now:
- B‑tree index scans / index‑only scans
- Recovery & replication
- All write operations INSERT, UPDATE, DELETE, WAL writes
- Small OLTP lookups that touch a single heap page
Future work is expected to widen coverage, especially index‑only scans and some write‑path optimizations.
Significant improvements for cloud volumes
Community benchmarks show that PostgreSQL 18 AIO significantly improves cold cache data reads in cloud setups with network‑attached storage where latency is high. AWS documentation states that average latency of Block Express volumes is “under 500 microseconds for 16 KiB I/O size”, when latency of General Purpose volumes can exceed 800 microseconds. Some articles suggest that under high load each physical block read from disk can cost around 1ms, while page processing in PostgreSQL is much cheaper. By combining many pages into one read, all these pages together now cost around 1ms. And by performing multiple reading requests at the same time in parallel, we effectively pay that 1ms latency just once per the whole batch.
Asynchronous I/O methods
The new subsystem can run in one of three modes, configured via io_method parameter with possible values “worker” (default), “io_uring“, and “sync“. We will cover how each works and then show how to monitor asynchronous I/O in our environment.
io_method = sync
This mode effectively turns AIO off. Reads are executed through the same AIO API but synchronously, using regular preadv or pwritev methods on the backend process that issued the I/O. This method does not use any extra shared memory and is intended mainly for regression testing or if we suspect AIO is misbehaving. It is also used internally as fall back to the synchronous I/O for operations which cannot use asynchronous I/O. PostgreSQL core functions issue an error, if some extension would try to force asynchronous I/O through AIO API when global io_method is set to “sync”. Available benchmarks show that this PostgreSQL 18 mode performs similarly to PostgreSQL 17’s streaming I/O.
io_method = io_uring (Linux only)
SELECT pg_config FROM pg_config() where pg_config::text ilike ’%liburing%’;
- Backends write requests via API into a submission ring in shared memory
- The kernel performs I/O asynchronously and writes results into a completion ring
- Completion ring content is consumed by the backend with fewer context switches
Execution still happens in the same process, like with the “sync” method, but it uses kernel worker threads for parallel processing. This typically shines on very fast NVMe SSDs.
However, io_uring Linux feature also has had a rough security history. It bypasses traditional syscall audit paths and therefore has been involved in a large share of Linux kernel exploits. Google reported that 60% of Linux kernel vulnerabilities in 2022 involved io_uring and some security tools were unable to uncover these types of attacks. Therefore some container environments disable io_uring entirely.
io_method = worker
This is the cross‑platform, “safe” implementation and the default in PostgreSQL 18. Mechanism is very similar to existing parallel query processing. The main difference is that background I/O workers are long‑lived independent processes created at server start, not short‑lived processes spawned per query.
- At server start, the postmaster creates a pool of I/O worker processes. Number is controlled by io_workers parameter with a default of 3. However, benchmarks suggest this number should be higher on many‑core machines, typically between ¼ and ½ of available CPU threads. Best value depends on workload and storage latency.
- Backends submit read requests into a shared memory submission queue. This submission queue is generally a ring buffer that multiple backends can write into concurrently. It contains only metadata about the request – handle indices, not full request record. There is only one submission queue for the entire cluster, not per database or per backend. The actual details of the request are stored in separate memory structure.
- Request is checked if it must be executed synchronously or can be handled asynchronously. Synchronous execution can also be chosen if the submission queue is full. This avoids problems with shared memory usage under extreme load. In case of synchronous execution, code uses path for “sync” method described above.
- Request submission in shared memory wakes up one I/O worker, which pops request and executes traditional blocking read() / pread() calls. If queue is still not empty, woken worker can wake up 2 additional workers to process it in parallel. Note in code mentions that this can be in the future extended to configurable N workers. This limit helps to avoid so called “thundering herd problem”, when single submitter would wake up too many workers causing havoc and locks for other backends.
- One limitation for asynchronous I/O is the fact, that workers cannot simply reuse file descriptors opened by backends, they must reopen files in their own context. If this is not possible for some types of operations, synchronous I/O path is used for that specific request.
- When workers finish a request without an error, they write data blocks into share buffers, put result into a completion queue and signal the backend.
- From the perspective of the backend, I/O becomes “asynchronous”, because the “waiting” happens in worker processes, not in the query process itself.
- Works on all supported OSes
- Simple error handling: if a worker crashes, requests are marked as failed, worker exits and a new worker is spawned by postmaster
- Avoids the security concerns around Linux io_uring interface
- The downside is extra context switches and possible shared‑memory queue contention, but for many workloads the ability to overlap reads easily pays for that
- This method improves performance even in the case when all blocks are just copied from local Linux memory cache, because it is now done in parallel
Tuning the New I/O Parameters
PostgreSQL 18 adds or updates several parameters related to disk I/O. We already covered io_method and io_workers; let’s look at the others. Another new parameters are io_combine_limit and io_max_combine_limit. They control how many data pages PostgreSQL groups into a single AIO request. Larger requests typically yield better throughput, but can also increase latency and memory usage. Values without units are interpreted in 8kB data blocks. With units (kB, MB), they directly represent size – however, should be multiples of 8kB.
Parameter io_max_combine_limit is a hard server‑start cap, io_combine_limit is the user‑tunable value that can be changed at runtime but cannot exceed the max. Default values of both is 128kB (16 data pages). But documentation recommends setting up to 1MB on Unix (128 data pages) and 128kB on Windows (16 data pages – due to limitations in internal Widows buffers). We can experiment with higher values, but based on HW and OS limits AIO benefits plateau after some chunk size; pushing this too high doesn’t help and can even increase latency.
PostgreSQL 18 introduces also io_max_concurrency setting, which controls max number of IOs that one process can execute simultaneously. Default setting -1 means value will be selected automatically based on other settings, but it cannot exceed 64.
Other related parameter is effective_io_concurrency – number of concurrent I/O operations that can be executed simultaneously on storage. Range of values is from 1 to 1000, value 0 disables asynchronous I/O requests. Default value is now 16, some community articles suggest to go up to 200 on modern SSDs. Best setting depends on specific hardware and OS, however, some articles also warn that too high value may significantly increase I/O latency for all queries.
How to Monitor Asynchronous I/O
pg_stat_activity
SELECT pid, backend_start, wait_event_type, wait_event, backend_type
FROM pg_stat_activity
WHERE backend_type = 'io worker';


  pid |        backend_start          | wait_event_type |  wait_event  | backend_type
------+-------------------------------+-----------------+--------------+--------------
   34 | 2025-12-09 11:44:23.852461+00 | Activity        | IoWorkerMain | io worker
   35 | 2025-12-09 11:44:23.852832+00 | Activity        | IoWorkerMain | io worker
   36 | 2025-12-09 11:44:23.853119+00 | IO              | DataFileRead | io worker
   37 | 2025-12-09 11:44:23.8534+00   | IO              | DataFileRead | io worker
SELECT a.pid, a.usename, a.application_name, a.backend_type, a.state, a.query,
ai.operation, ai.state AS aio_state, ai.length AS aio_bytes, ai.target_desc
FROM pg_aios ai
JOIN pg_stat_activity a ON a.pid = ai.pid
ORDER BY a.backend_type, a.pid, ai.io_id;


-[ RECORD 1 ]----+------------------------------------------------------------------------
             pid | 58
         usename | postgres
application_name | psql
    backend_type | client backend
           state | active
           query | explain analyze SELECT ........
       operation | readv
       aio_state | SUBMITTED
       aio_bytes | 704512
     target_desc | blocks 539820..539905 in file "pg_tblspc/16647/PG_18_202506291/5/16716"
-[ RECORD 2 ]----+------------------------------------------------------------------------
             pid | 159
         usename | postgres
application_name | psql
    backend_type | parallel worker
           state | active
           query | explain analyze SELECT ........
       operation | readv
       aio_state | SUBMITTED
       aio_bytes | 704512
     target_desc | blocks 536326..536411 in file "pg_tblspc/16647/PG_18_202506291/5/16716"
pg_aios: Current AIO handles
- pid: backend issuing the I/O
- io_id, io_generation: identify a handle across reuse
- state: HANDED_OUT, DEFINED, STAGED, SUBMITTED, COMPLETED_IO, COMPLETED_SHARED, COMPLETED_LOCAL
- operation: invalid, readv (vectored read) or writev (vectored write)
- off, length: offset and size of I/O operation
- target, target_desc: what we’re reading/writing (typically relations)
- result: UNKNOWN, OK, PARTIAL, WARNING, ERROR
-- Summary of current AIO handles by state and result
SELECT state, result, count(*) AS cnt, pg_size_pretty(sum(length)) AS total_size
FROM pg_aios GROUP BY state, result ORDER BY state, result;

       state      |  result | cnt | total_size
------------------+---------+-----+------------
 COMPLETED_SHARED | OK      |   1 | 688 kB
 SUBMITTED        | UNKNOWN |   6 | 728 kB

-- In-flight async I/O handles
SELECT COUNT(*) AS aio_handles, SUM(length) AS aio_bytes FROM pg_aios;

 aio_handles | aio_bytes
-------------+-----------
           7 |     57344

-- Sessions currently waiting on I/O
SELECT COUNT(*) AS sessions_waiting_on_io FROM pg_stat_activity WHERE wait_event_type = 'IO';

 sessions_waiting_on_io
------------------------
9SELECT pid, state, operation, pg_size_pretty(length) AS io_size, target_desc, result FROM pg_aios ORDER BY pid, io_id; pid | state | operation | io_size | target_desc | result -----+-----------+-----------+------------+-------------------------------------------------------------------------+--------- 51 | SUBMITTED | readv | 688 kB | blocks 670470..670555 in file "pg_tblspc/16647/PG_18_202506291/5/16716" | UNKNOWN 63 | SUBMITTED | readv | 8192 bytes | block 1347556 in file "pg_tblspc/16647/PG_18_202506291/5/16719" | UNKNOWN 65 | SUBMITTED | readv | 688 kB | blocks 671236..671321 in file "pg_tblspc/16647/PG_18_202506291/5/16716" | UNKNOWN 66 | SUBMITTED | readv | 8192 bytes | block 1344674 in file "pg_tblspc/16647/PG_18_202506291/5/16719" | UNKNOWN 67 | SUBMITTED | readv | 8192 bytes | block 1337819 in file "pg_tblspc/16647/PG_18_202506291/5/16719" | UNKNOWN 68 | SUBMITTED | readv | 688 kB | blocks 672002..672087 in file "pg_tblspc/16647/PG_18_202506291/5/16716" | UNKNOWN 69 | SUBMITTED | readv | 688 kB | blocks 673964..674049 in file "pg_tblspc/16647/PG_18_202506291/5/16716" | UNKNOWN
pg_stat_io: Cumulative I/O stats
SELECT backend_type, context, sum(reads) AS reads,
pg_size_pretty(sum(read_bytes)) AS read_bytes,
round(sum(read_time)::numeric, 2) AS read_ms, sum(writes) AS writes,
pg_size_pretty(sum(write_bytes)) AS write_bytes,
round(sum(write_time)::numeric, 2) AS write_ms, sum(extends) AS extends,
pg_size_pretty(sum(extend_bytes)) AS extend_bytes
FROM pg_stat_io
WHERE object = 'relation' AND backend_type IN ('client backend')
GROUP BY backend_type, context
ORDER BY backend_type, context;

   backend_type |  context  |  reads  | read_bytes |  read_ms  | writes | write_bytes | write_ms | extends | extend_bytes
----------------+-----------+---------+------------+-----------+--------+-------------+----------+---------+--------------
 client backend | bulkread  |   13833 | 9062 MB    | 124773.28 |      0 | 0 bytes     |     0.00 |         |
 client backend | bulkwrite |       0 | 0 bytes    |      0.00 |      0 | 0 bytes     |     0.00 |       0 | 0 bytes
 client backend | init      |       0 | 0 bytes    |      0.00 |      0 | 0 bytes     |     0.00 |       0 | 0 bytes
 client backend | normal    | 2265214 | 17 GB      | 553940.57 |      0 | 0 bytes     |     0.00 |       0 | 0 bytes
 client backend | vacuum    |       0 | 0 bytes    |      0.00 |      0 | 0 bytes     |     0.00 |       0 | 0 bytes


-- Top tables by heap blocks read and cache hit ratio
SELECT relid::regclass AS table_name, heap_blks_read, heap_blks_hit,
ROUND( CASE WHEN heap_blks_read + heap_blks_hit = 0 THEN 0
ELSE heap_blks_hit::numeric / (heap_blks_read + heap_blks_hit) * 100 END, 2) AS cache_hit_pct
FROM pg_statio_user_tables
ORDER BY heap_blks_read DESC LIMIT 20;

      table_name      | heap_blks_read | heap_blks_hit | cache_hit_pct
----------------------+----------------+---------------+---------------
 table1               |       18551282 |       3676632 |         16.54
 table2               |        1513673 |     102222970 |         98.54
 table3               |          19713 |       1034435 |         98.13
...


-- Top indexes by index blocks read and cache hit ratio
SELECT relid::regclass AS table_name, indexrelid::regclass AS index_name,
idx_blks_read, idx_blks_hit
FROM pg_statio_user_indexes
ORDER BY idx_blks_read DESC LIMIT 20;

 table_name |    index_name   | idx_blks_read | idx_blks_hit
------------+-----------------+---------------+--------------
 table1     | idx_table1_date |        209289 |          141
 table2     | table2_pkey     |         37221 |      1223747
 table3     | table3_pkey     |          9825 |      3143947
...SELECT pg_stat_reset_shared('io');Then run our workload and query pg_stat_io again to see how many bytes were read/written and how much time was spent waiting on I/O.
Conclusion
PostgreSQL is a registered trademark oftThe PostgreSQL Community Association of Canada.
As I explained in my talk on PostgreSQL Conference Europe 2025, data corruption can be silently present in any PostgreSQL database and will remain undetected until we physically read corrupted data. There can be many reasons why some data blocks in tables or other objects can be damaged. Even modern storage hardware is far from being infallible. Binary backups done with pg_basebackup tool – which is very common backup strategy in PostgreSQL environment – leave these problems hidden. Because they do not check data but copy whole data files as they are. With release of PostgreSQL 18, the community decided to turn on data‑checksums by default – a major step toward early detection of these failures. This post examines how PostgreSQL implements checksums, how it handles checksum failures, and how we can enable them on existing clusters.