Patroni is a clustering solution for PostgreSQL® that is getting more and more popular in the cloud and Kubernetes sector due to its operator pattern and integration with Etcd or Consul. Some time ago we wrote a blog post about the integration of Patroni into Debian. Recently, the vip-manager project which is closely related to Patroni has been uploaded to Debian by us. We will present vip-manager and how we integrated it into Debian in the following.
To recap, Patroni uses a distributed consensus store (DCS) for leader-election and failover. The current cluster leader periodically updates its leader-key in the DCS. As soon the key cannot be updated by Patroni for whatever reason it becomes stale. A new leader election is then initiated among the remaining cluster nodes.
PostgreSQL Client-Solutions for High-Availability
From the user’s point of view it needs to be ensured that the application is always connected to the leader, as no write transactions are possible on the read-only standbys. Conventional high-availability solutions like Pacemaker utilize virtual IPs (VIPs) that are moved to the primary node in the case of a failover.
For Patroni, such a mechanism did not exist so far. Usually, HAProxy (or a similar solution) is used which does periodic health-checks on each node’s Patroni REST-API and routes the client requests to the current leader.
An alternative is client-based failover (which is available since PostgreSQL 10), where all cluster members are configured in the client connection string. After a connection failure the client tries each remaining cluster member in turn until it reaches a new primary.
vip-manager
A new and comfortable approach to client failover is vip-manager. It is a service written in Go that gets started on all cluster nodes and connects to the DCS. If the local node owns the leader-key, vip-manager starts the configured VIP. In case of a failover, vip-manager removes the VIP on the old leader and the corresponding service on the new leader starts it there. The clients are configured for the VIP and will always connect to the cluster leader.
Debian-Integration of vip-manager
For Debian, the pg_createconfig_patroni program from the Patroni package has been adapted so that it can now create a vip-manager configuration:
pg_createconfig_patroni 11 test --vip=10.0.3.2
Similar to Patroni, we start the service for each instance:
systemctl start vip-manager@11-test
The output of patronictl shows that pg1 is the leader:
+---------+--------+------------+--------+---------+----+-----------+
| Cluster | Member |    Host    |  Role  |  State  | TL | Lag in MB |
+---------+--------+------------+--------+---------+----+-----------+
| 11-test |  pg1   | 10.0.3.247 | Leader | running |  1 |           |
| 11-test |  pg2   | 10.0.3.94  |        | running |  1 |         0 |
| 11-test |  pg3   | 10.0.3.214 |        | running |  1 |         0 |
+---------+--------+------------+--------+---------+----+-----------+
In journal of ‘pg1’ it can be seen that the VIP has been configured:
Jan 19 14:53:38 pg1 vip-manager[9314]: 2020/01/19 14:53:38 IP address 10.0.3.2/24 state is false, desired true
Jan 19 14:53:38 pg1 vip-manager[9314]: 2020/01/19 14:53:38 Configuring address 10.0.3.2/24 on eth0
Jan 19 14:53:38 pg1 vip-manager[9314]: 2020/01/19 14:53:38 IP address 10.0.3.2/24 state is true, desired true
If LXC containers are used, one can also see the VIP in the output of lxc-ls -f:
NAME    STATE   AUTOSTART GROUPS IPV4                 IPV6 UNPRIVILEGED
pg1     RUNNING 0         -      10.0.3.2, 10.0.3.247 -    false
pg2     RUNNING 0         -      10.0.3.94            -    false
pg3     RUNNING 0         -      10.0.3.214           -    false
The vip-manager packages are available for Debian testing (bullseye) and unstable, as well as for the upcoming 20.04 LTS Ubuntu release (focal) in the official repositories. For Debian stable (buster), as well as for Ubuntu 19.04 and 19.10, packages are available at apt.postgresql.org maintained by credativ, along with the updated Patroni packages with vip-manager integration.
Switchover Behaviour
In case of a planned switchover, e.g. pg2 becomes the new leader:
# patronictl -c /etc/patroni/11-test.yml switchover --master pg1 --candidate pg2 --force
Current cluster topology
+---------+--------+------------+--------+---------+----+-----------+
| Cluster | Member |    Host    |  Role  |  State  | TL | Lag in MB |
+---------+--------+------------+--------+---------+----+-----------+
| 11-test |  pg1   | 10.0.3.247 | Leader | running |  1 |           |
| 11-test |  pg2   | 10.0.3.94  |        | running |  1 |         0 |
| 11-test |  pg3   | 10.0.3.214 |        | running |  1 |         0 |
+---------+--------+------------+--------+---------+----+-----------+
2020-01-19 15:35:32.52642 Successfully switched over to "pg2"
+---------+--------+------------+--------+---------+----+-----------+
| Cluster | Member |    Host    |  Role  |  State  | TL | Lag in MB |
+---------+--------+------------+--------+---------+----+-----------+
| 11-test |  pg1   | 10.0.3.247 |        | stopped |    |   unknown |
| 11-test |  pg2   | 10.0.3.94  | Leader | running |  1 |           |
| 11-test |  pg3   | 10.0.3.214 |        | running |  1 |         0 |
+---------+--------+------------+--------+---------+----+-----------+
The VIP has now been moved to the new leader:
NAME    STATE   AUTOSTART GROUPS IPV4                 IPV6 UNPRIVILEGED
pg1     RUNNING 0         -      10.0.3.247          -    false
pg2     RUNNING 0         -      10.0.3.2, 10.0.3.94 -    false
pg3     RUNNING 0         -      10.0.3.214          -    false
This can also be seen in the journals, both from the old leader:
Jan 19 15:35:31 pg1 patroni[9222]: 2020-01-19 15:35:31,634 INFO: manual failover: demoting myself
Jan 19 15:35:31 pg1 patroni[9222]: 2020-01-19 15:35:31,854 INFO: Leader key released
Jan 19 15:35:32 pg1 vip-manager[9314]: 2020/01/19 15:35:32 IP address 10.0.3.2/24 state is true, desired false
Jan 19 15:35:32 pg1 vip-manager[9314]: 2020/01/19 15:35:32 Removing address 10.0.3.2/24 on eth0
Jan 19 15:35:32 pg1 vip-manager[9314]: 2020/01/19 15:35:32 IP address 10.0.3.2/24 state is false, desired false
As well as from the new leader pg2:
Jan 19 15:35:31 pg2 patroni[9229]: 2020-01-19 15:35:31,881 INFO: promoted self to leader by acquiring session lock
Jan 19 15:35:31 pg2 vip-manager[9292]: 2020/01/19 15:35:31 IP address 10.0.3.2/24 state is false, desired true
Jan 19 15:35:31 pg2 vip-manager[9292]: 2020/01/19 15:35:31 Configuring address 10.0.3.2/24 on eth0
Jan 19 15:35:31 pg2 vip-manager[9292]: 2020/01/19 15:35:31 IP address 10.0.3.2/24 state is true, desired true
Jan 19 15:35:32 pg2 patroni[9229]: 2020-01-19 15:35:32,923 INFO: Lock owner: pg2; I am pg2
As one can see, the VIP is moved within one second.
Updated Ansible Playbook
Our Ansible-Playbook for the automated setup of a three-node cluster on Debian has also been updated and can now configure a VIP if so desired:
# ansible-playbook -i inventory -e vip=10.0.3.2 patroni.yml
Questions and Help
Do you have any questions or need help? Feel free to write to info@credativ.com.
The PostgreSQL® Global Development Group (PGDG) has released version 12 of the popular, free database PostgreSQL®. As our Beta 4 article already suggested, a multitude of new features, improvements, and optimizations have been incorporated into the release. These include:
Optimized storage utilization and speed for btree indexes
btree indexes, the standard index type in PostgreSQL®, have received several optimizations in PostgreSQL® 12.
Historically, btree indexes stored duplicates (i.e., multiple entries with the same key values) in an unsorted order. This resulted in suboptimal utilization of the physical representation in the affected indexes. An optimization now stores these multiple key values in the same order as they are physically stored in the table. This improves storage utilization and reduces the overhead for managing corresponding btree indexes. Furthermore, indexes with multiple indexed columns use an improved physical representation, which also enhances their storage utilization. To benefit from this in PostgreSQL® 12, these indexes must be rebuilt or reindexed if the upgrade to the new version was performed via binary upgrade using pg_upgrade.
Insert operations into btree indexes are also accelerated by improved locking.
Improvements for pg_checksums
credativ has contributed an extension for pg_checksums that allows activating or deactivating block checksums in stopped PostgreSQL® instances. Previously, this could only be done by recreating the physical data representation of the cluster via initdb.
pg_checksums now also features the ability to display a status history on the console with the parameter --progress. The corresponding code contributions come from colleagues Michael Banck and Bernd Helmle.
Optimizer Inlining of Common Table Expressions
Up to and including PostgreSQL® 11, the PostgreSQL® Optimizer was unable to optimize Common Table Expressions (also known as CTEs or WITH queries). If such an expression was used in a query, the CTE was always evaluated and materialized first before the rest of the query was processed. For more complex CTE expressions, this led to correspondingly expensive execution plans. The following generic example clearly illustrates this. Given a join with a CTE expression that filters all even numbers from a numeric column:
WITH t_cte AS (SELECT id FROM foo WHERE id % 2 = 0) SELECT COUNT(*) FROM t_cte JOIN bar USING(id);
In PostgreSQL® 11, the use of a CTE always leads to a CTE Scan, which materializes the CTE expression first:
EXPLAIN (ANALYZE, BUFFERS) WITH t_cte AS (SELECT id FROM foo WHERE id % 2 = 0) SELECT COUNT(*) FROM t_cte JOIN bar USING(id) ;
  QUERY PLAN
─────────────────────────────────────────────────────────────────────────────────────────────────────────────────────────
  Aggregate (cost=2231.12..2231.14 rows=1 width=8) (actual time=48.684..48.684 rows=1 loops=1)
  Buffers: shared hit=488
  CTE t_cte
  ->  Seq Scan on foo (cost=0.00..1943.00 rows=500 width=4) (actual time=0.055..17.146 rows=50000 loops=1)
  Filter: ((id % 2) = 0)
  Rows Removed by Filter: 50000
  Buffers: shared hit=443
  ->  Hash Join (cost=270.00..286.88 rows=500 width=0) (actual time=7.297..47.966 rows=5000 loops=1)
  Hash Cond: (t_cte.id = bar.id)
  Buffers: shared hit=488
  ->  CTE Scan on t_cte (cost=0.00..10.00 rows=500 width=4) (actual time=0.063..31.158 rows=50000 loops=1)
  Buffers: shared hit=443
  ->  Hash (cost=145.00..145.00 rows=10000 width=4) (actual time=7.191..7.192 rows=10000 loops=1)
  Buckets: 16384 Batches: 1 Memory Usage: 480kB
  Buffers: shared hit=45
  ->  Seq Scan on bar (cost=0.00..145.00 rows=10000 width=4) (actual time=0.029..3.031 rows=10000 loops=1)
  Buffers: shared hit=45
  Planning Time: 0.832 ms
  Execution Time: 50.562 ms
(19 rows)
This plan first materializes the CTE with a Sequential Scan with the corresponding filter (id % 2 = 0). No functional index is used here, so this scan is correspondingly more expensive. Afterwards, the result of the CTE is joined with the table bar via Hash Join with the corresponding Join condition. With PostgreSQL® 12, the optimizer now gains the ability to inline these CTE expressions without prior materialization. The underlying, optimized plan in PostgreSQL® 12 then looks like this:
EXPLAIN (ANALYZE, BUFFERS) WITH t_cte AS (SELECT id FROM foo WHERE id % 2 = 0) SELECT COUNT(*) FROM t_cte JOIN bar USING(id) ;
  QUERY PLAN
───────────────────────────────────────────────────────────────────────────────────────────────────────────────────────────────────────────
  Aggregate (cost=706.43..706.44 rows=1 width=8) (actual time=9.203..9.203 rows=1 loops=1)
  Buffers: shared hit=148
  ->  Merge Join (cost=0.71..706.30 rows=50 width=0) (actual time=0.099..8.771 rows=5000 loops=1)
  Merge Cond: (foo.id = bar.id)
  Buffers: shared hit=148
  ->  Index Only Scan using foo_id_idx on foo (cost=0.29..3550.29 rows=500 width=4) (actual time=0.053..3.490 rows=5001 loops=1)
  Filter: ((id % 2) = 0)
  Rows Removed by Filter: 5001
  Heap Fetches: 10002
  Buffers: shared hit=74
  ->  Index Only Scan using bar_id_idx on bar (cost=0.29..318.29 rows=10000 width=4) (actual time=0.038..3.186 rows=10000 loops=1)
  Heap Fetches: 10000
  Buffers: shared hit=74
  Planning Time: 0.646 ms
  Execution Time: 9.268 ms
(15 rows)
The advantage of this method is that the initial materialization of the CTE expression is omitted. Instead, the query is executed directly with a Join.
This works for all non-recursive CTE expressions without side effects (e.g., CTEs with write statements) and those that are referenced only once per query. The old optimizer behavior can be forced with the WITH ... AS MATERIALIZED ... statement.
Generated Columns
New in PostgreSQL ® 12 are so-called Generated Columns, which calculate a result based on existing column values using expressions. These are stored with the corresponding source values in the tuple. The advantage is that the creation of triggers for subsequent calculation of column values can be avoided. The following simple example, based on a price table with net and gross prices, illustrates the new functionality:
CREATE TABLE preise(netto numeric,
  brutto numeric GENERATED ALWAYS AS (netto * 1.19) STORED);

INSERT INTO preise VALUES(17.30);
INSERT INTO preise VALUES(225);
INSERT INTO preise VALUES(247);
INSERT INTO preise VALUES(19.15);

SELECT * FROM preise;
  netto │ brutto
───────┼─────────
  17.30 │ 20.5870
  225 │ 267.75
  247 │ 293.93
  19.15 │ 22.7885
(4 rows)
The brutto column is calculated directly from the net price. The keyword STORED is mandatory. Of course, indexes can also be created on Generated Columns, but they cannot be part of a primary key. Furthermore, the SQL expression must be unambiguous, i.e., it must yield the same result even with the same input set. Columns declared as Generated Columns cannot be explicitly used in INSERT or UPDATE operations. If a column list is absolutely necessary, the corresponding value can be indirectly referenced with the keyword DEFAULT.
Removal of explicit OID columns
Explicit OID columns were historically a way to create unique column values so that a table row could be uniquely identified database-wide. For a long time, however, these have only been explicitly created in PostgreSQL®, and their fundamental functionality is considered obsolete. With PostgreSQL®, the ability to explicitly create such columns is now finally abolished. This means it will no longer be possible to specify the WITH OIDS directive for tables. System tables, which have always uniquely referenced objects by OID, will now return OID values without explicit specification of OID columns in the result set. Older software, in particular, that carelessly handled catalog queries, could encounter problems due to duplicate column output.
Moving recovery.conf to the postgresql.conf
Up to and including PostgreSQL® 11, database recovery and streaming replication instances were configured via a separate configuration file recovery.conf.
With PostgreSQL® 12, all configuration work previously done there now moves to the postgresql.conf. The recovery.conf file is no longer used. PostgreSQL® 12 refuses to start if this file is present. Whether recovery or a streaming standby is desired is now decided either by a recovery.signal file (for recovery) or standby.signal (for standby systems). The latter takes precedence if both files are present. The old parameter standby_mode, which previously controlled this behavior, has been removed.
For automatic deployments of high-availability systems, this represents a major change. However, it is now also possible to perform almost all corresponding configuration work via ALTER SYSTEM, so that only one configuration file needs to be maintained.
REINDEX CONCURRENTLY
With PostgreSQL® 12, there is now a way to rebuild indexes with as few locks as possible. This significantly simplifies one of the most common maintenance tasks in very write-intensive databases. Previously, a combination of CREATE INDEX CONCURRENTLY and DROP INDEX CONCURRENTLY had to be used. Care also had to be taken to assign new index names accordingly.
The Release Notes provide an even more detailed overview of all new features and, especially, incompatibilities compared to previous PostgreSQL® versions.
This article was originally written by Bernd Helmle.
Yesterday, the fourth beta of the upcoming PostgreSQL®-major version 12 was released.
Compared to its predecessor PostgreSQL® 11, there are many new features:
- Performance improvements for indexes: btree indexes now manage space more efficiently. The REINDEX command now also supports CONCURRENTLY, which was previously only possible with new indexes.
- WITH queries are now embedded in the main query and thus optimized much better by the planner. Previously, WITH queries were always executed independently.
- The native partitioning was further improved. Foreign keys can now also reference partitioned tables. Maintenance commands such as ATTACH PARTITION no longer require an exclusive table lock.
- The support of page checksums and the tool pg_checksums was further improved, also with substantial cooperation by credativ.
- It is now possible to integrate additional storage engines. The “zheap”, which is still under development, will be based on this, which promises more compact data storage with less bloat.
Of course, PostgreSQL® 12 will be tested using sqlsmith, the SQL “fuzzer” from our colleague Andreas Seltenreich. Numerous bugs in different PostgreSQL® versions were found with sqlsmith by using randomly generated SQL queries.
Debian and Ubuntu packages for PostgreSQL® 12 are going to be published on apt.postgresql.org with credativ’s help. This work will be handled by our colleague Christoph Berg.
The release of PostgreSQL® 12 is expected in the next weeks.
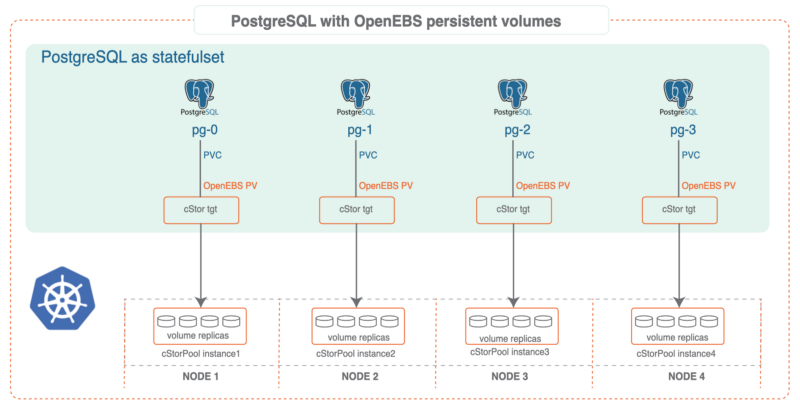
In this article, we look at running PostgreSQL® in a highly available setup in a Kubernetes environment—a topic that is certainly of particular interest to many of our PostgreSQL® users.
Together with our partner company MayaData, we demonstrate below the use cases and benefits of the extremely powerful open-source project OpenEBS.
OpenEBS is a freely available storage management system whose development is supported and guided by MayaData.
We would like to extend our special thanks to Murat-Karslioglu from MayaData and our colleague Adrian Vondendriesch for this interesting and helpful article, which the colleagues have, of course, written in English this time due to the international collaboration.
PostgreSQL® anywhere — via Kubernetes with some help from OpenEBS and credativ engineering
by Murat Karslioglu, OpenEBS and Adrian Vondendriesch, credativ
Introduction
If you are already running Kubernetes on some form of cloud whether on-premises or as a service, you understand the ease-of-use, scalability and monitoring benefits of Kubernetes — and you may well be looking at how to apply those benefits to the operation of your databases.
PostgreSQL® remains a preferred relational database, and although setting up a highly available Postgres cluster from scratch might be challenging at first, we are seeing patterns emerging that allow PostgreSQL® to run as a first class citizen within Kubernetes, improving availability, reducing management time and overhead, and limiting cloud or data center lock-in.
There are many ways to run high availability with PostgreSQL®; for a list, see the PostgreSQL® Documentation. Some common cloud-native Postgres cluster deployment projects include Crunchy Data’s, Sorint.lab’s Stolon and Zalando’s Patroni/Spilo. Thus far we are seeing Zalando’s operator as a preferred solution in part because it seems to be simpler to understand and we’ve seen it operate well.
Some quick background on your authors:
- OpenEBS is a broadly deployed OpenSource storage and storage management project sponsored by MayaData.
- credativ is a leading open source support and engineering company with particular depth in PostgreSQL®.
In this blog, we’d like to briefly cover how using cloud-native or “container attached” storage can help in the deployment and ongoing operations of PostgreSQL® on Kubernetes. This is the first of a series of blogs we are considering — this one focuses more on why users are adopting this pattern and future ones will dive more into the specifics of how they are doing so.
At the end you can see how to use a Storage Class and a preferred operator to deploy PostgreSQL® with OpenEBS underlying
If you are curious about what container attached storage of CAS is you can read more from the Cloud Native Computing Foundation (CNCF) here.
Conceptually you can think of CAS as being the decomposition of previously monolithic storage software into containerized microservices that themselves run on Kubernetes. This gives all the advantages of running Kubernetes that already led you to run Kubernetes — now applied to the storage and data management layer as well. Of special note is that like Kubernetes, OpenEBS runs anywhere so the same advantages below apply whether on on-premises or on any of the many hosted Kubernetes services.
PostgreSQL® plus OpenEBS
We have seen joint users adopting OpenEBS as a substrate to PostgreSQL® for a variety of reasons. A few that jump out include:
Consistency in underlying disk or cloud volume management:
One of the most annoying things about setting up a system to run PostgreSQL® — even if it is on Kubernetes — is configuring the underlying disks and storage systems as needed. With a solution like OpenEBS, you specify via storage classes how you want the underlying systems configured and OpenEBS with the help of Kubernetes ensures that the system delivers the storage capacity that is needed and that it is configured as you need it. An example of such a storage class is shared below. This automation can remove a source of human error and definitely removes a source of human annoyance.
Thin provisioning and on-demand expansion:
Now that you have turned over to OpenEBS the provisioning and management of the underlying storage hardware and services, you just have to tell it the amount of storage you need for your PostgreSQL® and then everything will work out well, right? Well actually knowing how much data your PostgreSQL® instance or instances will consume is pretty tricky — and arguably somewhat impossible as it is beyond your control.
Here OpenEBS can also help because it supports both thin provisioning and on the fly pool expansion. The thin provisioning allows you to claim more space than you actually can provisioning — this then allows your PostgreSQL® to scale in the usage of space without interruption by allowing for adding more storage to the running system without the need to stop the database.
Thin provisioning though is not a good idea if there is not also on the fly expansion of the underlying capacity for perhaps obvious reasons — as the PostgreSQL® expands you want to make sure it can claim space as needed otherwise at some point you’ll have to interrupt operations and again perform manual tasks. OpenEBS helps here as well — if configured to do so it can expand its underlying pools, whether these are of physical disks, underlying storage systems, or storage services from a cloud. The capacity of the pool can be expanded on demand simply by adding more disks to the cStor pool.
The cStor architecture also supports the resizing of a provisioned volume on the fly and this will be fully automated as of OpenEBS 0.9. Via these enhancements, volumes, as well as underlying pools, will be able to scale automatically on any cloud providing K8s support.
In addition to reducing the risk and hassle of manual operations, the combination of thin provisioning and on-demand scaling can reduce costs because you don’t over-provision capacity to achieve performance for example, which reduces unnecessary cloud service spending and can increase average utilization of usage of your hardware as well.
Disaster recovery and migration:
With a solution like OpenEBS, your storage classes can also include back-up schedules — and these can be easily managed either via Kubectl or via the free to use MayaOnline. Again these storage classes can be applied on a per container basis which is quite a bit of granularity and control by each team running their PostgreSQL®.
Additionally, we are working together to add tighter integration with PostgreSQL® to this per snapshot based workload, per container back-up capability, which is called DMaaS by MayaData and OpenEBS. With this additional integration, an option will be added to the storage classes and to OpenEBS to flush active transactions before taking the snapshot. The additional integration of storage snapshots in conjunction with Write Ahead Log (WAL) archiving will provide additional PITR functionality. DMaaS leverages the open source Velero from Heptio and marries it to the COW based capabilities of the cStor OpenEBS engine to deliver extremely efficient backups and migrations.
With DMaaS backups taken to one location can be recovered from another. This can prove useful for a variety of use cases including the use of relatively ephemeral clusters as a part of a rolling upgrade for example of an environment. Additionally, the same capability can be used to move workloads from one Kubernetes environment to another thereby reducing lock-in.
Snapshots and clones for development and troubleshooting:
DBAs have been using snapshots and clones for a long time to assist in troubleshooting and to enable teams to develop and test against a read-only copy of production data. For example, via OpenEBS you can easily use Kubernetes to invoke a snapshot and then promote that snapshot to a clone and then spawn a container from that clone. You now can do anything you want with that container and the data set contained within it, and of course, destroy it when you are done.
One use case that clones can support is improved reporting. For example, let’s say you do computationally expensive analytical queries and build roll-up queries for monthly reports. It is simple with OpenEBS to clone the underlying OLTP system, allowing you to work on a static copy of your database, thereby removing load from your production DBs and ensuring you have a verifiable source of information for those reports.
Closing the loop with per workload visibility and optimization:
In addition to the benefits of using OpenEBS, there are additional benefits from using MayaOnline for the management of stateful workloads. We may address these in future blogs examining common day 2 operations and optimization of your PostgreSQL® on Kubernetes.
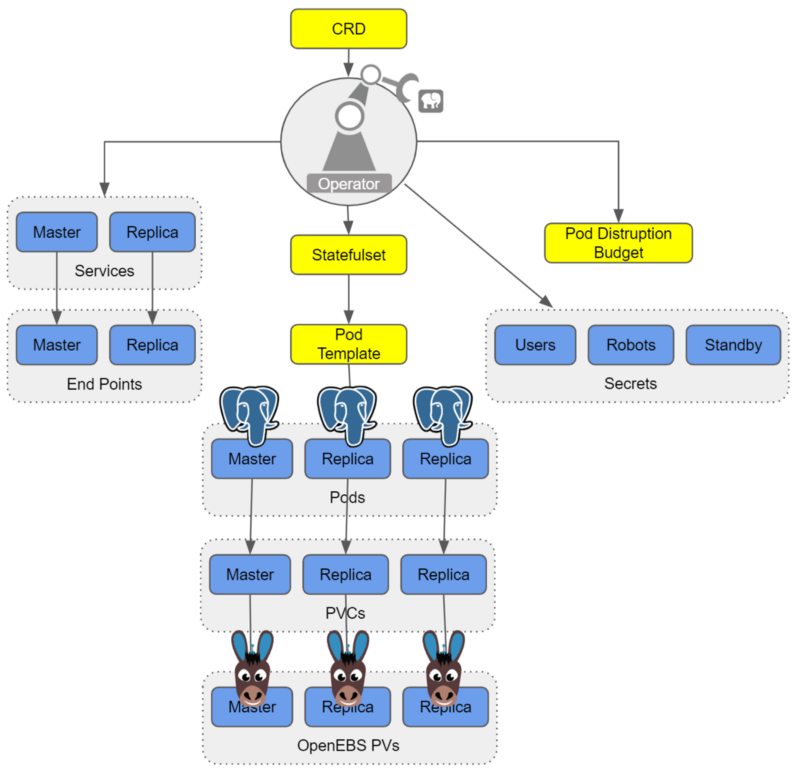
Running Postgres-Operator on OpenEBS
Software Prerequisites
- Postgres-Operator (for cluster deployment)
- Docker installed
- Kubernetes 1.9+ cluster installed
- kubectl installed
- OpenEBS installed
Install OpenEBS
- If OpenEBS is not installed in your K8s cluster, this can be done from here. If OpenEBS is already installed, go to the next step.
- Connect to MayaOnline (Optional): Connecting the Kubernetes cluster to MayaOnline provides good visibility of storage resources. MayaOnline has various support options for enterprise customers.
Configure cStor Pool
- If cStor Pool is not configured in your OpenEBS cluster, this can be done from here. As PostgreSQL® is a StatefulSet application, it requires a single storage replication factor. If you prefer additional redundancy you can always increase the replica count to 3.
During cStor Pool creation, make sure that the maxPools parameter is set to >=3. If a cStor pool is already configured, go to the next step. Sample YAML named openebs-config.yaml for configuring cStor Pool is provided in the Configuration details below.
openebs-config.yaml
#Use the following YAMLs to create a cStor Storage Pool.
# and associated storage class.
apiVersion: openebs.io/v1alpha1
kind: StoragePoolClaim
metadata:
 name: cstor-disk
spec:
 name: cstor-disk
 type: disk
 poolSpec:
 poolType: striped
 # NOTE — Appropriate disks need to be fetched using `kubectl get disks`

#
 # `Disk` is a custom resource supported by OpenEBS with `node-disk-manager`
 # as the disk operator
# Replace the following with actual disk CRs from your cluster `kubectl get disks`
# Uncomment the below lines after updating the actual disk names.
 disks:
 diskList:
# Replace the following with actual disk CRs from your cluster from `kubectl get disks`
# — disk-184d99015253054c48c4aa3f17d137b1
# — disk-2f6bced7ba9b2be230ca5138fd0b07f1
# — disk-806d3e77dd2e38f188fdaf9c46020bdc
# — disk-8b6fb58d0c4e0ff3ed74a5183556424d
# — disk-bad1863742ce905e67978d082a721d61
# — disk-d172a48ad8b0fb536b9984609b7ee653
 — -
Create Storage Class
- You must configure a StorageClass to provision cStor volume on a cStor pool. In this solution, we are using a StorageClass to consume the cStor Pool which is created using external disks attached on the Nodes. The storage pool is created using the steps provided in the Configure StoragePool section. In this solution, PostgreSQL® is a deployment. Since it requires replication at the storage level the cStor volume replicaCount is 3. Sample YAML named openebs-sc-pg.yaml to consume cStor pool with cStorVolume Replica count as 3 is provided in the configuration details below.
openebs-sc-pg.yaml
apiVersion: storage.k8s.io/v1
kind: StorageClass
metadata:
 name: openebs-postgres
 annotations:
 openebs.io/cas-type: cstor
 cas.openebs.io/config: |
 - name: StoragePoolClaim
 value: "cstor-disk"
 - name: ReplicaCount
 value: "3"
provisioner: openebs.io/provisioner-iscsi
reclaimPolicy: Delete
---
Launch and test Postgres Operator
- Clone Zalando’s Postgres Operator.
git clone https://github.com/zalando/postgres-operator.git
cd postgres-operator
Use the OpenEBS storage class
- Edit manifest file and add openebs-postgres as the storage class.
nano manifests/minimal-postgres-manifest.yaml
After adding the storage class, it should look like the example below:
apiVersion: "acid.zalan.do/v1"
kind: postgresql
metadata:
 name: acid-minimal-cluster
 namespace: default
spec:
 teamId: "ACID"
 volume:
 size: 1Gi
 storageClass: openebs-postgres
 numberOfInstances: 2
 users:
 # database owner
 zalando:
 - superuser
 - createdb

# role for application foo
 foo_user: []

#databases: name->owner
 databases:
 foo: zalando
 postgresql:
 version: "10"
 parameters:
 shared_buffers: "32MB"
 max_connections: "10"
 log_statement: "all"
Start the Operator
- Run the command below to start the operator
kubectl create -f manifests/configmap.yaml # configuration
kubectl create -f manifests/operator-service-account-rbac.yaml # identity and permissions
kubectl create -f manifests/postgres-operator.yaml # deployment
Create a Postgres cluster on OpenEBS
Optional: The operator can run in a namespace other than default. For example, to use the test namespace, run the following before deploying the operator’s manifests:
kubectl create namespace test
kubectl config set-context $(kubectl config current-context) — namespace=test
- Run the command below to deploy from the example manifest:
kubectl create -f manifests/minimal-postgres-manifest.yaml
2. It only takes a few seconds to get the persistent volume (PV) for the pgdata-acid-minimal-cluster-0 up. Check PVs created by the operator using the kubectl get pv command:
$ kubectl get pv
NAME CAPACITY ACCESS MODES RECLAIM POLICY STATUS CLAIM STORAGECLASS REASON AGE
pvc-8852ceef-48fe-11e9–9897–06b524f7f6ea 1Gi RWO Delete Bound default/pgdata-acid-minimal-cluster-0 openebs-postgres 8m44s
pvc-bfdf7ebe-48fe-11e9–9897–06b524f7f6ea 1Gi RWO Delete Bound default/pgdata-acid-minimal-cluster-1 openebs-postgres 7m14s
Connect to the Postgres master and test
- If it is not installed previously, install psql client:
sudo apt-get install postgresql-client
2. Run the command below and note the hostname and host port.
kubectl get service — namespace default |grep acid-minimal-cluster
3. Run the commands below to connect to your PostgreSQL® DB and test. Replace the [HostPort] below with the port number from the output of the above command:
export PGHOST=$(kubectl get svc -n default -l application=spilo,spilo-role=master -o jsonpath="{.items[0].spec.clusterIP}")
export PGPORT=[HostPort]
export PGPASSWORD=$(kubectl get secret -n default postgres.acid-minimal-cluster.credentials -o ‘jsonpath={.data.password}’ | base64 -d)
psql -U postgres -c ‘create table foo (id int)’
Congrats you now have the Postgres-Operator and your first test database up and running with the help of cloud-native OpenEBS storage.
Partnership and future direction
As this blog indicates, the teams at MayaData / OpenEBS and credativ are increasingly working together to help organizations running PostgreSQL® and other stateful workloads. In future blogs, we’ll provide more hands-on tips.
We are looking for feedback and suggestions on where to take this collaboration. Please provide feedback below or find us on Twitter or on the OpenEBS slack community.
Patroni is a PostgreSQL high availability solution with a focus on containers and Kubernetes. Until recently, the available Debian packages had to be configured manually and did not integrate well with the rest of the distribution. For the upcoming Debian 10 “Buster” release, the Patroni packages have been integrated into Debian’s standard PostgreSQL framework by credativ. They now allow for an easy setup of Patroni clusters on Debian or Ubuntu.
Patroni employs a “Distributed Consensus Store” (DCS) like Etcd, Consul or Zookeeper in order to reliably run a leader election and orchestrate automatic failover. It further allows for scheduled switchovers and easy cluster-wide changes to the configuration. Finally, it provides a REST interface that can be used together with HAProxy in order to build a load balancing solution. Due to these advantages Patroni has gradually replaced Pacemaker as the go-to open-source project for PostgreSQL high availability.
However, many of our customers run PostgreSQL on Debian or Ubuntu systems and so far Patroni did not integrate well into those. For example, it does not use the postgresql-common framework and its instances were not displayed in pg_lsclusters output as usual.
Integration into Debian
In a collaboration with Patroni lead developer Alexander Kukushkin from Zalando the Debian Patroni package has been integrated into the postgresql-common framework to a large extent over the last months. This was due to changes both in Patroni itself as well as additional programs in the Debian package. The current Version 1.5.5 of Patroni contains all these changes and is now available in Debian “Buster” (testing) in order to setup Patroni clusters.
The packages are also available on apt.postgresql.org and thus installable on Debian 9 “Stretch” and Ubuntu 18.04 “Bionic Beaver” LTS for any PostgreSQL version from 9.4 to 11.
The most important part of the integration is the automatic generation of a suitable Patroni configuration with the pg_createconfig_patroni command. It is run similar to pg_createcluster with the desired PostgreSQL major version and the instance name as parameters:
pg_createconfig_patroni 11 test
This invocation creates a file /etc/patroni/11-test.yml, using the DCS configuration from /etc/patroni/dcs.yml which has to be adjusted according to the local setup. The rest of the configuration is taken from the template /etc/patroni/config.yml.in which is usable in itself but can be customized by the user according to their needs. Afterwards the Patroni instance is started via systemd similar to regular PostgreSQL instances:
systemctl start patroni@11-test
A simple 3-node Patroni cluster can be created and started with the following few commands, where the nodes pg1, pg2 and pg3 are considered to be hostnames and the local file dcs.yml contains the DCS configuration:
for i in pg1 pg2 pg3; do ssh $i 'apt -y install postgresql-common'; done
for i in pg1 pg2 pg3; do ssh $i 'sed -i "s/^#create_main_cluster = true/create_main_cluster = false/" /etc/postgresql-common/createcluster.conf'; done
for i in pg1 pg2 pg3; do ssh $i 'apt -y install patroni postgresql'; done
for i in pg1 pg2 pg3; do scp ./dcs.yml $i:/etc/patroni; done
for i in pg1 pg2 pg3; do ssh @$i 'pg_createconfig_patroni 11 test' && systemctl start patroni@11-test'; done
Afterwards, you can get the state of the Patroni cluster via
ssh pg1 'patronictl -c /etc/patroni/11-patroni.yml list'
+---------+--------+------------+--------+---------+----+-----------+
| Cluster | Member |    Host    |  Role  |  State  | TL | Lag in MB |
+---------+--------+------------+--------+---------+----+-----------+
| 11-test |  pg1   | 10.0.3.111 | Leader | running |  1 |           |
| 11-test |  pg2   | 10.0.3.41  |        | stopped |    |   unknown |
| 11-test |  pg3   | 10.0.3.46  |        | stopped |    |   unknown |
+---------+--------+------------+--------+---------+----+-----------+
Leader election has happened and pg1 has become the primary. It created its instance with the Debian-specific pg_createcluster_patroni program that runs pg_createcluster in the background. Then the two other nodes clone from the leader using the pg_clonecluster_patroni program which sets up an instance using pg_createcluster and then runs pg_basebackup from the primary. After that, all nodes are up and running:
+---------+--------+------------+--------+---------+----+-----------+
| Cluster | Member |    Host    |  Role  |  State  | TL | Lag in MB |
+---------+--------+------------+--------+---------+----+-----------+
| 11-test |  pg1   | 10.0.3.111 | Leader | running |  1 |         0 |
| 11-test |  pg2   | 10.0.3.41  |        | running |  1 |         0 |
| 11-test |  pg3   | 10.0.3.46  |        | running |  1 |         0 |
+---------+--------+------------+--------+---------+----+-----------+
The well-known Debian postgresql-common commands work as well:
ssh pg1 'pg_lsclusters'
Ver Cluster Port Status Owner    Data directory                 Log file
11  test    5432 online postgres /var/lib/postgresql/11/test    /var/log/postgresql/postgresql-11-test.log
Failover Behaviour
If the primary is abruptly shutdown, its leader token will expire after a while and Patroni will eventually initiate failover and a new leader election:
+---------+--------+-----------+------+---------+----+-----------+
| Cluster | Member |    Host   | Role |  State  | TL | Lag in MB |
+---------+--------+-----------+------+---------+----+-----------+
| 11-test |  pg2   | 10.0.3.41 |      | running |  1 |         0 |
| 11-test |  pg3   | 10.0.3.46 |      | running |  1 |         0 |
+---------+--------+-----------+------+---------+----+-----------+
[...]
+---------+--------+-----------+--------+---------+----+-----------+
| Cluster | Member |    Host   |  Role  |  State  | TL | Lag in MB |
+---------+--------+-----------+--------+---------+----+-----------+
| 11-test |  pg2   | 10.0.3.41 | Leader | running |  2 |         0 |
| 11-test |  pg3   | 10.0.3.46 |        | running |  1 |         0 |
+---------+--------+-----------+--------+---------+----+-----------+
[...]
+---------+--------+-----------+--------+---------+----+-----------+
| Cluster | Member |    Host   |  Role  |  State  | TL | Lag in MB |
+---------+--------+-----------+--------+---------+----+-----------+
| 11-test |  pg2   | 10.0.3.41 | Leader | running |  2 |         0 |
| 11-test |  pg3   | 10.0.3.46 |        | running |  2 |         0 |
+---------+--------+-----------+--------+---------+----+-----------+
The old primary will rejoin the cluster as standby once it is restarted:
+---------+--------+------------+--------+---------+----+-----------+
| Cluster | Member |    Host    |  Role  |  State  | TL | Lag in MB |
+---------+--------+------------+--------+---------+----+-----------+
| 11-test |  pg1   | 10.0.3.111 |        | running |    |   unknown |
| 11-test |  pg2   | 10.0.3.41  | Leader | running |  2 |         0 |
| 11-test |  pg3   | 10.0.3.46  |        | running |  2 |         0 |
+---------+--------+------------+--------+---------+----+-----------+
[...]
+---------+--------+------------+--------+---------+----+-----------+
| Cluster | Member |    Host    |  Role  |  State  | TL | Lag in MB |
+---------+--------+------------+--------+---------+----+-----------+
| 11-test |  pg1   | 10.0.3.111 |        | running |  2 |         0 |
| 11-test |  pg2   | 10.0.3.41  | Leader | running |  2 |         0 |
| 11-test |  pg3   | 10.0.3.46  |        | running |  2 |         0 |
+---------+--------+------------+--------+---------+----+-----------+
If a clean rejoin is not possible due to additional transactions on the old timeline the old primary gets re-cloned from the current leader. In case the data is too large for a quick re-clone, pg_rewind can be used. In this case a password needs to be set for the postgres user and regular database connections (as opposed to replication connections) need to be allowed between the cluster nodes.
Creation of additional Instances
It is also possible to create further clusters with pg_createconfig_patroni, one can either assign a PostgreSQL port explicitly via the --port option, or let pg_createconfig_patroni assign the next free port as is known from pg_createcluster:
for i in pg1 pg2 pg3; do ssh $i 'pg_createconfig_patroni 11 test2 && systemctl start patroni@11-test2'; done
ssh pg1 'patronictl -c /etc/patroni/11-test2.yml list'
+----------+--------+-----------------+--------+---------+----+-----------+
| Cluster  | Member |       Host      |  Role  |  State  | TL | Lag in MB |
+----------+--------+-----------------+--------+---------+----+-----------+
| 11-test2 |  pg1   | 10.0.3.111:5433 | Leader | running |  1 |         0 |
| 11-test2 |  pg2   |  10.0.3.41:5433 |        | running |  1 |         0 |
| 11-test2 |  pg3   |  10.0.3.46:5433 |        | running |  1 |         0 |
+----------+--------+-----------------+--------+---------+----+-----------+
Ansible Playbook
In order to easily deploy a 3-node Patroni cluster we have created an Ansible playbook on Github. It automates the installation and configuration of PostgreSQL and Patroni on the three nodes, as well as the DCS server on a fourth node.
Questions and Help
Do you have any questions or need help? Feel free to write to info@credativ.com.
This week version 1.3 of our PostgreSQL® appliance Elephant Shed was released.
The highlight of the new version is support for Red Hat Enterprise Linux 7 and CentOS 7. As is already the case for Debian, the appliance heavily relies on the postgresql-common infrastructure which was previously ported to RPM.
The well-known PostgreSQL® RPM packages from yum.postgresql.org are integrated into the system via pg_createcluster and can be administrated from the Elephant Shed web interface.
All other Elephant Shed components like pgAdmin4, Grafana, Prometheus, pgbackrest, Cockpit or shellinabox work in the same way as in the Debian version of the appliance. Only the SELinux functionality has to be deactivated in order to run pgAdmin4 and shellinabox as their packages do not support this.
Besides the port to RPM the appliance infrastructure was updated. The Prometheus node-exporter is now available in version 0.16 in which many metric names were adjusted to the Prometheus naming scheme. The Grafana dashboard was updated accordingly. The Apache configuration was switched from authnz_pam to authnz_external as the former is not available on CentOS and stable functionality could not longer be guaranteed on Debian Buster.
The next items on the Elephant-Shed roadmap are the integration of the REST-API in order to control particular components, as well as multi-host support so that several Elephant-Shed instances can be controlled simultaneously.
An overhaul of the user interface is planned as well.
The updated packages are available for download at packages.credativ.com. If Elephant-Shed was installed already, the updates are provided via apt as usual.
The open-source PostgreSQL® appliance Elephant-Shed is developed by credativ and is increasingly popular, as the most important compontents for the administration of PostgreSQL® servers are already included. Adjustments and extensions can be done at any time.
Comprehensible technical support for Elephant-Shed is offered by credativ including guaranteed service-level agreements and optional 365 days and 24/7 hours.
The second beta release of PostgreSQL 11 (which is now feature frozen) has been released recently. Time to look at some of the improvements that credativ has contributed in the area of checksums and backups.
Checksum verification during base backups
Since version 9.3 it is possible to enable checksums for the underlying storage of tables and indices during instance creation. Those checksums raise SQL errors if bit errors are encountered in their respective data pages, which allows for early discovery of storage issues. However those checksums are only verified if queries access the corrupted page. Running an explicit check is only possible with the forthcoming pg_verify_checksums application from version 11, however, it requires an offline instance in order to work.
Our change allows for verification of checksums during base backups. This is a good opportunity to verify the checksum consistency as all data blocks needs to be read during a base backup anyway. Checksum failures are logged as warnings (rather than errors) in order not to abort the whole base backup when they occur. The commonly used pg_basebackup application was extended with the –no-verify-checksums option which disables the verification.
Replication slots during base backups
The second change concerns the handling of replication slots by pg_basebackup during the setup of standby servers. Replication slots allow a primary to reserve the required transaction logs for the standby associated with the slot, even if it is temporarily down. Previous releases already allowed using a replication slot with pg_basebackup, however, this slot had to be created manually beforehand. Our change adds the new option -C or –create-slot and allows the on-shot creation of a standby clone including the usage of replication slots:
$ pg_basebackup -v -h primary.lan -D data --slot=standby1 --create-slot --write-recovery-conf
pg_basebackup: initiating base backup, waiting for checkpoint to complete
pg_basebackup: checkpoint completed
pg_basebackup: write-ahead log start point: 0/1D000028 on timeline 1
pg_basebackup: starting background WAL receiver
pg_basebackup: created replication slot "standby1"
pg_basebackup: write-ahead log end point: 0/1D0000F8
pg_basebackup: waiting for background process to finish streaming ...
pg_basebackup: base backup completed
$ cat data2/recovery.conf
standby_mode = 'on'
primary_conninfo = 'user=postgres passfile=''/var/lib/postgresql/.pgpass'' host=primary.lan
  port=5432 sslmode=prefer sslcompression=1 krbsrvname=postgres target_session_attrs=any'
primary_slot_name = 'standby1'
Afterwards the standby just has to be started and will replicate automatically.
In addition, several other small improvements to pg_basebackup and its testsuite were done by us.
Parallel dump to /dev/null
A patch that did not make it into the release is presented here nevertheless: parallel pg_dump to /dev/null in the directory format. The reason for it is the common usage of pg_dump to check for errors in a PostgreSQL instance where /dev/null/ is used a target in order not to use additional disk space. The problem is that /dev/null can only be used in the custom format which does not allow dumping in parallel. The directory format supports multiple concurrent processes but cannot use /dev/null as target as it is not a directory. Our patch adds support for /dev/null as a target when using the directory format.
The reasons for the rejection were not technical issues with the patch but the fact that pg_dump is not a diagnostics tool and no special support for that should be included. Nevertheless, the submitted patch works and is being used by our clients. Versions of the patch for PostgreSQL 9.3, 9.4, 9.5, 9.6 and 10 are available.
The credativ PostgreSQL® Competence Center has released a project roadmap for the PostgreSQL® Appliance Elephant Shed.
Elephant Shed is a freely available PostgreSQL® solution developed by credativ, which combines management, monitoring and administration into one system.
The project roadmap for 2018 includes following points:
- Q2 2018: Support for Ubuntu 18.04
- Q3 2018: Support for CentOS 7
An additional planned feature is the implementation of REST API to control individual components. REST stands for REpresentational State Transfer and is an application programming interface based on the behavior of the World Wide Web. Specifically the PostgreSQL® database and the backup via pgBackRest should be addressed.
Multi host support is also planned. A central control of several Elephant Shed instances is thus possible.
In order to make Elephant Shed even more user friendly, various configuration parameters of the web interface are going to be adjusted.
The project roadmap is of course also constantly being worked on. On GitHub you can leave us your feedback at any time.
We would like to take this opportunity to thank all users and testers, and look forward to further development of the project!
For further information please visit elephant-shed.io and GitHub.
This article was originally written by Philip Haas
Elephant Shed is now also available as a Vagrant box. This makes it very easy to test and evaluate the PostgreSQL® appliance.
Vagrant is an open-source tool for creating portable virtual software environments. Using scripts, it can easily generate virtual machines with a software component installed for testing. Vagrant itself is only the manager; various backends such as VirtualBox or cloud providers can be used for the actual virtualization.
For the development of Elephant Shed, we have relied on Vagrant from the beginning. This box is now also available in the Vagrant Cloud.
To use this box, Vagrant and VirtualBox must be installed. The host operating system is irrelevant (Linux/macOS/Windows); the box runs Debian Stretch. The box is then automatically downloaded by Vagrant:
vagrant init credativ/elephant-shed
vagrant up
This creates a virtual machine running Elephant Shed in VirtualBox on your computer.
- Default user:
admin - Default password:
admin - The web interface listens on port 4433: https://localhost:4433
- PostgreSQL® listens on port 55432:
psql -h localhost -p 55432 -U admin
We welcome your feedback!
Further information can be found on our Elephant Shed project page and on GitHub.
This article was originally written by Christoph Berg.
At the beginning of 2018, issues with memory management and Intel processors became public. According to these reports, it is apparently possible to read arbitrary areas of the kernel and userspace memory regions and thus potentially gain access to sensitive areas.
Over the past few days, there have been rumors and speculations about the direction of these developments; meanwhile, there is an official statement from the hackers at Project Zero (Google) who summarize the findings.
What exactly happened?
Essentially, attack vectors were identified that can extract privileged information from the CPU cache, despite a lack of authorization, by leveraging unsuccessful speculative code execution on a processor and precise timing. In doing so, it is possible, despite the lack of authorization (whether from user or kernel space), to read memory areas and interpret their contents. This theoretically enables widespread entry points for malware, such as spying on sensitive data or abusing permissions. These are referred to as Side Channel Attacks. According to current knowledge, not only Intel CPUs (which were initially exclusively assumed to be affected) are impacted, but also AMD CPUs, ARM, and POWER8 and 9 processors.
What is currently happening?
Project Zero summarizes the main issues in the report. Several exploits exist that use different approaches to read privileged memory areas, thereby unauthorizedly accessing information in sensitive areas of the kernel or other processes. Since almost all modern CPUs support speculative execution of instructions to prevent their execution units from idling and thus avoid associated high latencies, a large number of systems are theoretically affected. Another starting point for this attack scenario is the way user and kernel space memory areas interact in current systems. In fact, these memory areas have not truly been separated until now; instead, access to these areas is secured by a special bit. The advantage of this lack of separation is particularly significant when, for example, frequent switching between user and kernel space is required.
The individual attack scenarios are:
- Spectre
This attack scenario utilizes the branch prediction present in modern CPUs, i.e., a preliminary analysis of the probability that certain code or branches can be executed successfully. Here, the CPU is tricked into speculatively executing code that was not actually considered by the prediction. This attack can then be used to execute malicious code. This attack theoretically works on all CPUs with corresponding branch prediction, but according to Project Zero, it is difficult to summarize which processors are affected and in what way. Spectre primarily targets applications in user space. Since Spectre primarily works when faulty code is already present in relevant applications, particular attention should be paid to corresponding updates.
- Meltdown
With Meltdown, speculative execution is used to execute code that cannot actually be reached definitively. These are exception instructions with subsequent instructions that would never be executed. However, due to the CPU’s speculative execution, these instructions are still considered by the CPU. Although there are no side effects from this type of execution, the memory addresses occupied by the instruction remain in the CPU’s cache and can be used from there to test all memory addresses. Since the memory areas of the kernel and user space are currently organized contiguously, not only the entire memory area of the kernel but also all processes running on the system can be read. A detailed description of how the attack works can be found here. Meltdown only works on Intel processors, as only on these are privileges for the addressed memory area no longer checked during out-of-order execution.
Both scenarios exploit the respective security vulnerabilities in different ways. The CVEs for the vulnerabilities are:
What happens next?
To prevent Meltdown attacks, corresponding updates are already available for Linux, Windows, and OSX (the latter has contained corresponding changes for quite some time). Essentially, these updates completely separate memory management for kernel and user space (known in Linux as KPTI patches, Kernel Page Table Isolation, formerly also KAISER). This makes it no longer possible to access kernel memory areas from an unprivileged context through privilege escalation on Intel processors. RedHat, as well as CentOS and Fedora, already provide these with updated kernels.
Meltdown attacks, in particular, are effectively suppressed by this; however, for Spectre attacks themselves, based on the current situation, there are no reliable, effective measures. It is important, however, that eBPF and the corresponding execution of BPF code in the Linux kernel are deactivated.
sysctl -a | grep net.core.bpf_jit_enable
sysctl net.core.bpf_jit_enable=0
The change requires “root” permissions.
Performance of Updated Kernels
Due to the separation of memory management for kernel and user space, context switches and system calls become more expensive. This leads to significantly higher latencies, especially if the application causes many context switches (e.g., network communication). The performance losses here are difficult to quantify, as not every workload truly relies on identical access patterns. For critical systems, load tests on identical test systems are therefore recommended if possible. If not possible, the load parameters should be carefully monitored after updating the system. A general performance loss of around 5% is assumed, but tests by kernel developers have also observed losses of up to 30%. Since Page Table Isolation (so far) is only available for x86_64 architectures, these figures only apply to machines with Intel processors. In fact, KPTI is not enabled by default for AMD by the kernel upstream.
Whether KPTI is enabled can be determined via the kernel log:
dmesg -T | grep "page tables isolation"
[Fr Jan  5 10:10:16 2018] Kernel/User page tables isolation: enabled
Database users, in particular, are sensitive here, as systems like PostgreSQL® typically cause a high number of context switches under heavy load. At credativ, we classified the impact on a small virtualized system. The basis is a Fedora 27 system as a KVM guest with 4 GByte RAM and fast NVMe storage. However, this plays a rather insignificant role in this test, as the database tests performed with pgbench only have a size of just under 750 MByte. The shared buffer pool of the PostgreSQL® instance was configured with 1 GByte so that the entire database fits into the database cache. The tests were performed with 4 and 8 virtual processors, respectively. The host system has an Intel Core i7-6770HQ processor.
The greatest impact is observed when PCID is not present or is deactivated in the kernel. PCID is an optimization that prevents a flush of the Translation Lookaside Buffer (TLB) when a context switch occurs. Virtual memory addresses are only successfully resolved via TLB if the PCID matches the current thread on the respective CPU. PCID is available from kernel 4.14. The test compares a development kernel with Page Table Isolation (PTI) 4.15.0-rc6, current Fedora upstream kernels with and without security patches. PTI can be deactivated by defining a corresponding argument to the kernel via pti=off during boot.
The Fedora test system already has a very recent kernel (4.14). The difference between the old upstream kernel 4.14.8 without security-relevant patches and the new kernel 4.14.11 is approximately 6%. pgbench then provides the following throughput rates (transactions per second):
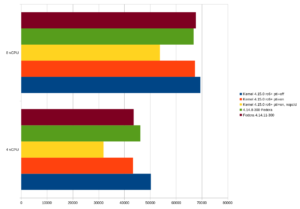
If the former standard kernel 4.14.8 of Fedora 27 is taken as 100%, the following results are obtained:

The PostgreSQL® community has also already conducted smaller tests to measure the impact. The results align with our findings. The new kernel 4.14.11 with the relevant patches offers approximately the same performance as the development kernel 4.15.0-rc6 on this platform. In these test cases, 4.14.11 even partially outperforms the old upstream kernel (8 vCPU, comparison 4.14.8, green and 4.14.11, brown). However, the advantage here is just over 1%, so it can be assumed that there are no significant speed differences in this test setup.
For those interested, there is also a dedicated page on the topic. This summarizes all essential information. Also recommended is the summary by journalist Hanno Böck on GitHub, which provides a very good list of all patches for Meltdown and Spectre.
This article was originally written by Bernd Helmle.
The pgAudit extension allows for fine-grained auditing of access to a PostgreSQL® database. Among other things, it is an important component of the recently published
While PostgreSQL® offers configurable logging by itself, the audit messages generated by pgAudit go significantly further and also cover most compliance guidelines. They are also written to the PostgreSQL® log, but in a uniform format and, in contrast to conventional logging via e.g. log_statement, they are deterministic and comprehensive on the one hand, and targeted on the other. For example, it was previously possible to log executed SELECT commands to detect unwanted access to a specific table, but since this then applies to all SELECT commands, it is not manageable in practice. With pgAudit’s so-called object audit logging, it is possible to write only access to specific tables to the audit log by assigning appropriate permissions to an auditor role, e.g.:
Prepare Database
CREATE ROLE AUDITOR;
SET pgaudit.role = 'auditor';
CREATE TABLE account
(
 id INT,
 name TEXT,
 password TEXT,
 description TEXT
);
GRANT SELECT (password) ON public.account TO auditor;
Abfragen, die die Spalte password betreffen (und nur solche) erscheinen nun im Audit-Log:
SELECT id, name FROM account;
SELECT password FROM account;
AUDIT: OBJECT,1,1,READ,SELECT,TABLE,public.account,SELECT password FROM account
Log content
The first field is either SESSION or OBJECT for the corresponding audit logging type. The two subsequent fields are statement IDs, the fourth field is the query class (READ, WRITE, ROLE, DDL, etc.), followed by the command type and (if applicable) the object type and name; the last field is finally the command actually executed. Crucial for auditing is that the commands actually executed are logged, so that circumvention through deliberate obfuscation is not possible. An example of this from the pgAudit documentation is:
AUDIT: SESSION,1,1,FUNCTION,DO,,,"DO $$
BEGIN
 EXECUTE 'CREATE TABLE import' || 'ant_table (id INT)';
END $$;"
AUDIT: SESSION,1,2,DDL,CREATE TABLE,TABLE,public.important_table,CREATE TABLE important_table (id INT)
As can be seen from the command used (lines 1-4), an attempt is made here to prevent the table name important_table from appearing in the log file, but pgAudit reliably logs the table name (field 7) as well as the actually executed CREATE TABLE statement. However, in the case of the conventional PostgreSQL® log, this attempt is successful; only the entered command is logged here:
LOG: statement: DO $$
BEGIN
 EXECUTE 'CREATE TABLE import' || 'ant_table (id INT)';
END $$;
The pgAudit extension can, in principle, be used from PostgreSQL® version 9.5 onwards. While the version 1.1 of pgAudit packaged by us officially only supports 9.6, the created Debian package can also be used with 9.5 thanks to an additional patch. Therefore, packages for both 9.6 and 9.5 are available on apt.postgresql.org for all supported Debian and Ubuntu versions.
See also:
Introduction
Today, there is no need to argue why centralized logging is useful or even necessary. Most medium-sized companies now have centralized logging or are currently implementing it.
Once the infrastructure is in place, it is important to use it effectively and efficiently! Especially as an infrastructure operator or service provider, the goal is to optimally support different stakeholders with different requirements. For example, the development department should have continuous access to all logs from their test systems. However, from production, perhaps only all error messages are needed in real time, but more upon request.
Such models can be easily implemented and tested with graylog® or Kibana®. Classification and analysis may work well and efficiently in test operations or small environments with PostgreSQL® default settings. However, when operating a large number of databases or retaining logs for extended periods, usage can quickly become difficult.
Problem Statement
Log entries are centrally captured and can in principle be used. In practice, however, it is difficult to impossible to extract all relevant information in a timely manner. Searching for specific entries requires full-text searches with wildcards, which is no longer practical with large data volumes.
For example, if you want to grant specific groups access exclusively to logs that meet certain functional criteria, such as database name, error_severity, or similar, this must be implemented through full-text search and error-prone filters.
If a DBA wants to see all messages from a specific user, a specific query, or a session, this requires particularly complex indexing for wildcard searches. Alternatively, such queries are very slow and cannot be answered immediately.
| Starting Point: | Centralized logging has already been implemented, e.g., ELK Stack or graylog®. |
| Goal: | We want to capture PostgreSQL® log messages semantically and thereby efficiently: classify, group, and analyze them. |
Alternative
The alternative is to capture log messages semantically and store the individual fields in an appropriate data structure.
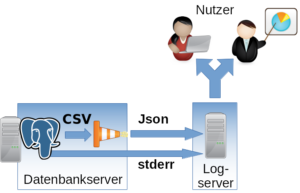
If the normal stderr log is used, parsing becomes difficult to impossible, as the individual fields cannot be identified. However, PostgreSQL® also offers the option to produce log messages in CSV format (csvlog). This outputs all fields comma-separated.
Excursus: The idea is not new. For a long time, some DBAs have been loading their logs directly back into a PostgreSQL® table. This allows them to search and process the logs with SQL and all familiar built-in tools. DBAs are usually very satisfied with this construct, but it represents an isolated solution. Example table for PostgreSQL® 9.5: CREATE TABLE postgres_log ( log_time timestamp(3) with time zone, user_name text, database_name text, process_id integer, connection_from text, session_id text, session_line_num bigint, command_tag text, session_start_time timestamp with time zone, virtual_transaction_id text, transaction_id bigint, error_severity text, sql_state_code text, message text, detail text, hint text, internal_query text, internal_query_pos integer, context text, query text, query_pos integer, location text, application_name text, PRIMARY KEY (session_id, session_line_num) ); |
Structure
Implementation
The csvlog can serve as the basis for efficiently populating a centralized logging system. To keep further processing as simple as possible and to avoid committing to a specific logging system, we translate the log from CSV to JSON. It can then be fed in as desired. In the following example, TCP is used.
To change the log format, the following options must be adjusted in PostgreSQL®:
#------------------------------------------------------------------------------
# ERROR REPORTING AND LOGGING
#------------------------------------------------------------------------------

# - Where to Log -

log_destination = 'csvlog' # Valid values are combinations of
  # stderr, csvlog, syslog, and eventlog,
  # depending on platform. csvlog
  # requires logging_collector to be on.

# This is used when logging to stderr:
logging_collector = on # Enable capturing of stderr and csvlog
  # into log files. Required to be on for
  # csvlogs.
  # (change requires restart)
  # These are only used if logging_collector is on:
log_directory = '/var/log/postgresql' # directory where log files are written,
  # can be absolute or relative to PGDATA
For parsing and translating to JSON as well as delivering to the logging system, we use logstash® with the following configuration as a Jinja2 template:
input {
  file {
  "path" =>  "/var/log/postgresql/*.csv"
  "sincedb_path" =>  "/tmp/sincedb_pgsql"
  # fix up multiple lines in log output into one entry
  codec =>  multiline {
  pattern =>  "^%{TIMESTAMP_ISO8601}.*"
  what =>  previous
  negate =>  true
  }
  }
}

# Filter is tested for PostgreSQL®  9.5
filter {
  csv {
  columns =>  [ "pg_log_time", "pg_user_name", "pg_database_name",
  "pg_process_id", "pg_connection_from", "pg_session_id",
  "pg_session_line_num", "pg_command_tag",
  "pg_session_start_time", "pg_virtual_transaction_id",
  "pg_transaction_id", "pg_error_severity", "pg_sql_state_code",
  "pg_sql_message", "pg_detail", "pg_hint", "pg_internal_query",
  "pg_internal_query_pos", "pg_context", "pg_query",
  "pg_query_pos", "pg_location", "pg_application_name" ]
  }

  date {
  #2014-05-22 17:02:35.069 CDT
  match =>  ["log_time", "YYYY-MM-dd HH:mm:ss.SSS z"]
  }

  mutate {
  add_field =>  {
  "application_name" =>  "postgres"
  }
  }

}

output {
  tcp {
  host =>  "{{ log_server }}"
  port =>  {{ log_port }}
  codec =>  "json_lines"
  }
}
It is important that the filter for translating the CSV fields is adapted to the PostgreSQL® major version being used. The fields can differ from version to version. In most cases, new fields are added.
Also note that logstash® has difficulty recognizing the timestamp independently. The specific format should be specified (time zone).
The following variables must be set:
| {{ log_server }} | Log server, in our case a graylog® |
| {{ log_port }} | Port on the log server |
Configured this way, log files can be efficiently classified and searched. Permissions are also easier to manage.
- Permission at database level => pg_database_name
- Severity => pg_error_severity
- Permission for logs from specific hosts => pg_connection_from
- Permission for logs from specific applications => pg_application_name
Important: The normal stderr log should in any case still be included in centralized logging. After startup, no normal operational messages from PostgreSQL® will appear here, but error outputs from involved processes will. For example, the stderr output of a failed archive command can be found here. This information is essential for administration.
We already support numerous customers in operating the described procedure in production. If you have questions about this topic or need support, please feel free to contact our PostgreSQL® Competence Center.
This article was originally written by Alexander Sosna.