For some time now, a large part of the IT landscape has been talking only about “containers”, “microservices” and “Kubernetes.”
But what exactly are containers and what technical basis are they based on?
General
Simply put, a container is an isolated runtime environment for processes. There are various areas that can be separated – the most important being processes (pid), network (net), volumes / hard disks (mnt) and user / group IDs (user).
The technology behind this is called “namespaces” and was first implemented in the Linux Kernel since version 2.4.19 (2002) and later expanded, but only since version 3.8 (2013) in userspace, i.e. meaningfully usable for users. In addition, the cgroups technology plays a major role here. This makes it possible to provide the separate areas with resources such as CPU and RAM, or to define them.
A well-known and early implementation of these features is lxc (linux containers), which is still being developed today and implements these features close to the system.
Linux Namespaces
A namespace is a way to divide resources and objects into logical groups. You could also describe it as a system context in which a process is started. It is not a problem to create your own namespaces within a namespace for newly started processes.
An example from daily practice:
When a Linux host starts, an instance is created for each namespace type. The init process with PID 1 (usually systemd today) is then assigned to the instances accordingly. This is transparent and only of limited relevance for most users. This is because all system resources are available to these namespaces and new resources are initially assigned to them.
To view a list of the namespaces currently running on the system, there is the tool lsns.
In the following example, we see the initially created namespaces and the assignment of the init process.
[root@buildah ~]# lsns -p1
        NS TYPE   NPROCS PID USER COMMAND
4026531835 cgroup     96   1 root /usr/lib/systemd/systemd --switched-root --system --deserialize 18
4026531836 pid        96   1 root /usr/lib/systemd/systemd --switched-root --system --deserialize 18
4026531837 user       95   1 root /usr/lib/systemd/systemd --switched-root --system --deserialize 18
4026531838 uts        96   1 root /usr/lib/systemd/systemd --switched-root --system --deserialize 18
4026531839 ipc        96   1 root /usr/lib/systemd/systemd --switched-root --system --deserialize 18
4026531840 mnt        90   1 root /usr/lib/systemd/systemd --switched-root --system --deserialize 18
4026531992 net        96   1 root /usr/lib/systemd/systemd --switched-root --system --deserialize 18
A process can only ever be assigned to one namespace per type. For example, the process with PID 1 from the example above cannot be assigned an additional pid namespace.
The different types have no interactions or dependencies with each other. For example, you can assign a new process (e.g. a shell) only its own net-namespace.
To create a new namespace as a user, there is the tool unshare. Using parameters, it is possible to specify which namespace types should be created for the process.
The following is an example of how a container-like environment (in which all possible areas are separated from the host system) can be created manually.
To do this, we start a bash shell with the parameters shown as a normal user without root permissions.
[podmanager@buildah ~]$ unshare --mount --uts --ipc --net --pid --fork --user --map-root-user /bin/bash

[root@buildah ~]# id
uid=0(root) gid=0(root) Gruppen=0(root) Kontext=unconfined_u:unconfined_r:unconfined_t:s0-s0:c0.c1023

[root@buildah ~]# ip a
1: lo: <LOOPBACK> mtu 65536 qdisc noop state DOWN group default qlen 1000
    link/loopback 00:00:00:00:00:00 brd 00:00:00:00:00:00

[root@buildah ~]# lsns
        NS TYPE   NPROCS   PID USER COMMAND
4026531835 cgroup      3   952 root unshare --mount --uts --ipc --net --pid --fork --user --map-root-user /bin/bash
4026531836 pid         1   952 root unshare --mount --uts --ipc --net --pid --fork --user --map-root-user /bin/bash
4026532192 user        3   952 root unshare --mount --uts --ipc --net --pid --fork --user --map-root-user /bin/bash
4026532193 mnt         3   952 root unshare --mount --uts --ipc --net --pid --fork --user --map-root-user /bin/bash
4026532194 uts         3   952 root unshare --mount --uts --ipc --net --pid --fork --user --map-root-user /bin/bash
4026532196 ipc         3   952 root unshare --mount --uts --ipc --net --pid --fork --user --map-root-user /bin/bash
4026532198 pid         2   953 root /bin/bash
4026532200 net         3   952 root unshare --mount --uts --ipc --net --pid --fork --user --map-root-user /bin/bash
As you can see, the process is now in an encapsulated area with its own IDs and network area. However, the entire hard disk configuration was also transferred to the new area, including the /proc folder, in which the processes of the host system are listed.
[root@buildah ~]# ps -ef f  | head
UID        PID  PPID  C STIME TTY      STAT   TIME CMD
nobody       2     0  0 14:22 ?        S      0:00 [kthreadd]
nobody       3     2  0 14:22 ?        I<     0:00  \_ [rcu_gp]
nobody       4     2  0 14:22 ?        I<     0:00  \_ [rcu_par_gp]
nobody       6     2  0 14:22 ?        I<     0:00  \_ [kworker/0:0H-kblockd]
nobody       8     2  0 14:22 ?        I<     0:00  \_ [mm_percpu_wq]
nobody       9     2  0 14:22 ?        S      0:00  \_ [ksoftirqd/0]
nobody      10     2  0 14:22 ?        I      0:00  \_ [rcu_sched]
nobody      11     2  0 14:22 ?        S      0:00  \_ [migration/0]
nobody      12     2  0 14:22 ?        S      0:00  \_ [watchdog/0]
To correct this, a mount -t proc proc /proc is required. This overlays the /proc of the host system, meaning that only the processes of the new environment are visible.
[root@buildah ~]# mount -t proc proc /proc
[root@buildah ~]# ps -ef f
UID        PID  PPID  C STIME TTY      STAT   TIME CMD
root         1     0  0 15:05 pts/1    S      0:00 /bin/bash
root        27     1  0 15:11 pts/1    R+     0:00 ps -ef f
To leave the environment, simply type exit, or the key combination STRG+D.
[root@buildah ~]# exit
exit
[podmanager@buildah ~]$
cgroups
Control Groups (cgroups for short) are not a direct namespace, but allow processes to be grouped in a type of namespace and the available resources such as CPU and / or RAM to be limited or prioritized.
There is now an updated version of cgroups (cgroupsV2) in the kernel. However, this is probably only used productively by Fedora >= 31, as there are some incompatibilities with Docker here, but not with Podman.
However, the setup is somewhat more complex and will therefore not be explained here, but will be the subject of a separate article.
Further information can be found for those interested here (cgroupsv1) and here (cgroupsv2)
The file system of a container
Each container contains all the components necessary for the operation of the binaries, such as libraries and binaries.
The only dependency on the host system is generally that the applications must be able to run on the kernel of the host system.
However, the file system is not a separate hard disk or similar, but merely an archive that contains a directory tree.
This archive is then unpacked into a folder at the latest when a container is started and used as a new file system on this folder by means of an mnt namespace and chroot. The chroot changes the entry point for the file system to which the user has access. For example, /var/lib/docker/container1/dateisystem on the host becomes the new / within the container.
Here is an example with the separated environment from the previous section.
First, we export the file system of the Postgres container as a tar archive and then unpack it into a subfolder.
[podmanager@buildah ~]$ podman export 3b62694339c6 -o postgres_container.tar
[podmanager@buildah ~]$ ls -l postgres_container.tar
-rw-r--r--. 1 podmanager podmanager 313597440 31. Mär 15:31 postgres_container.tar
[podmanager@buildah ~]$ mkdir postgres_root
[podmanager@buildah ~]$ tar -xf postgres_container.tar -C postgres_root/
[podmanager@buildah ~]$ ls -l postgres_root/
insgesamt 12
drwxr-xr-x.  2 podmanager podmanager 4096  3. Mär 01:27 bin
drwxr-xr-x.  2 podmanager podmanager    6  1. Feb 18:09 boot
drwxr-xr-x.  2 podmanager podmanager    6 24. Feb 01:00 dev
drwxr-xr-x.  2 podmanager podmanager    6  3. Mär 01:27 docker-entrypoint-initdb.d
lrwxrwxrwx.  1 podmanager podmanager   34  4. Mär 18:35 docker-entrypoint.sh -> usr/local/bin/docker-entrypoint.sh
drwxr-xr-x. 37 podmanager podmanager 4096 31. Mär 14:24 etc
drwxr-xr-x.  2 podmanager podmanager    6  1. Feb 18:09 home
drwxr-xr-x.  8 podmanager podmanager   96 26. Feb 01:54 lib
drwxr-xr-x.  2 podmanager podmanager   34 24. Feb 01:00 lib64
drwxr-xr-x.  2 podmanager podmanager    6 24. Feb 01:00 media
drwxr-xr-x.  2 podmanager podmanager    6 24. Feb 01:00 mnt
drwxr-xr-x.  2 podmanager podmanager    6 24. Feb 01:00 opt
drwxr-xr-x.  2 podmanager podmanager    6  1. Feb 18:09 proc
drwx------.  2 podmanager podmanager   76 31. Mär 14:44 root
drwxr-xr-x.  5 podmanager podmanager   84 31. Mär 14:24 run
drwxr-xr-x.  2 podmanager podmanager 4096  3. Mär 01:27 sbin
drwxr-xr-x.  2 podmanager podmanager    6 24. Feb 01:00 srv
drwxr-xr-x.  2 podmanager podmanager    6  1. Feb 18:09 sys
drwxrwxr-x.  2 podmanager podmanager    6  3. Mär 01:27 tmp
drwxr-xr-x. 10 podmanager podmanager  105 24. Feb 01:00 usr
drwxr-xr-x. 11 podmanager podmanager  139 24. Feb 01:00 var
Now we create a shell with its own namespaces again and execute the chroot.
[podmanager@buildah ~]$ unshare --mount --uts --ipc --net --pid --fork --user --map-root-user /bin/bash

[root@buildah ~]# cat /etc/redhat-release
CentOS Linux release 8.1.1911 (Core)

[root@buildah ~]# chroot postgres_root

root@buildah:/var/lib/postgresql/data# /bin/cat /etc/issue
Debian GNU/Linux 10 \n \l
Finally, the /proc file system must be corrected, as mentioned.
Once this is done, we have the same working environment that we would have in a container.
root@buildah:/var/lib/postgresql/data# /bin/mount -t proc proc /proc

root@buildah:/var/lib/postgresql/data# /bin/ps -ef f
UID        PID  PPID  C STIME TTY      STAT   TIME CMD
root         1     0  0 13:34 ?        S      0:00 /bin/bash
root        27     1  0 13:35 ?        S      0:00 /bin/bash -i
root        54    27  0 13:43 ?        R+     0:00  \_ /bin/ps -ef f
Conclusion
This is of course only a quick overview of the technical framework of container technology, which is based on known features of the Linux kernel.
Docker and also Podman use these features, but offer many more functions and, above all, convenience functions for handling them.
At the latest when using container orchestration tools such as Kubernetes or okd, several layers of complexity are also added.
If you have any questions about the use of containers, please do not hesitate to contact us. Contact us!
In our previous article on Buildah, we explained how to create containers without Docker and root privileges.
This article will focus on how to use those very containers without elevated privileges.
Alongside the already mentioned Buildah and Skopeo, Podman is part of the Red Hat Container Tools and is, in short, a daemonless runtime environment for containers. Like the Docker daemon, it is designed for operating a single host and does not offer cluster functionality.
Development
Podman version 1.0 was released on January 11, 2019, and is also licensed under Apache 2.0.
The implementation is done in Golang and is primarily driven by the “containers organization”. This includes both Red Hat employees and external developers.
The code can be viewed on Github. Development does not follow a fixed release cycle. Thus, there can be months or weeks between versions, depending on when it is decided that enough new features have been implemented for a release.
Podman itself is built entirely on libpod, or one could say that it is the tool for libpod. Therefore, the repository’s name is libpod and not podman.
Containers without Root Privileges
A central component of both Buildah and Podman is libpod, which allows starting containers and creating images with user privileges only.
This relies on slirp4netns, fuse-overlayfs, and /etc/sub(u|g)id.
This topic has already been extensively covered in the Buildah article, which is why it is only referenced here to avoid repetition.
Installation
Podman is directly available in the repositories of common Red Hat distributions.
These can be installed there, depending on the version, via dnf install podman or yum install podman installed.
It should be noted that the packages in CentOS distributions are not necessarily up-to-date. Therefore, it is advisable to switch to Kubic here as well.
For Debian and derivatives, as well as Suse, packages are available in Kubic, similar to Buildah.
Further information can be found in the documentation
[podmanager@buildah ~]$ podman -v
podman version 1.8.2
Configuration
The configuration file for Podman is, similar to Builder, located under /etc/containers/libpod.conf for the global and under ~/.config/containers/libpod.conf for the user-specific configuration.
The template with default values can be found under /usr/share/containers/libpod.conf. However, this should not be adjusted directly, but rather through the two alternatives.
Various parameters for Podman can be configured in the file; such as which CNI plugin should be used, which container runtime, or where the container volumes are located.
An online example can be found on Github
However, no changes are required here for an initial test operation; it merely serves to adapt Podman to your own preferences if necessary.
Working with Podman
Podman was designed as a drop-in replacement for Docker, and therefore most commands like ps, rm, inspect, logs or exec are analogous to Docker and will only be briefly mentioned here if at all. The functionality is not limited to operating containers; it is also possible to create containers to a limited extent. In the background, Podman relies on Buildah’s functionality, but it can only create containers from a Containerfile.
Details can be found in the documentation.
A podman top $ContainerID also works, as does creating, migrating, and restoring a checkpoint.
[user@system1 ~]$ podman container checkpoint <container_id> -e /tmp/checkpoint.tar.gz
[user@system1 ~]$ scp /tmp/checkpoint.tar.gz <destination_system>:/tmp

[user@system2 ~]$ podman container restore -i /tmp/checkpoint.tar.gz
Therefore, the following sections will primarily focus on the differences in container handling between Docker and Podman.
Starting a Container
To start a container of choice (here, postgres), we pull the image and then start it.
[podmanager@buildah ~]$ podman pull postgres
...
Copying config 73119b8892 done
Writing manifest to image destination
Storing signatures
73119b8892f9cda38bb0f125b1638c7c0e71f4abe9a5cded9129c3f28a6d35c3

[podmanager@buildah ~]$ podman inspect postgres | grep "PG_VERSION="
 "PG_VERSION=12.2-2.pgdg100+1",
 "created_by": "/bin/sh -c #(nop) ENV PG_VERSION=12.2-2.pgdg100+1",

[podmanager@buildah ~]$ podman run -d -e POSTGRES_PASSWORD=SuperDB --name=postgres_dev postgres
c8b9732b6ad253710ae6e75f934a74e8469e61bc5b5d88c2fa92c7257d00d2e7
[podmanager@buildah ~]$ podman ps
CONTAINER ID IMAGE COMMAND CREATED STATUS PORTS NAMES
c8b9732b6ad2 docker.io/library/postgres:latest postgres 5 seconds ago Up 4 seconds ago postgres_dev
A PostgreSQL® container named “postgres_dev” is now running. This does not differ from Docker so far.
Podman’s unique feature only becomes apparent in the process list:
podmana+ 2209 1 0 13:11 ? Ssl 0:00 /usr/bin/conmon --api-version 1 -c c8b9732b6ad253710ae6e75f934a74e8469e61bc5b5d88c2fa92c7257d00d2e7 -u c8b9732b6ad253710ae6e75f934a74e8469e61bc5b5d88c2fa92c7257d00d2e7 -r /usr/bin/runc -b

232070 2219 2209 0 13:11 ? Ss 0:00 \_ postgres
The PostgreSQL® process does not run as a child of a daemon process, but rather as a child of the “conmon” component.
This monitors the container’s state after startup. It also provides the socket for communication and the stream for output, which
are written to the log configured by Podman.
Further information on conmon can be found on Github.
If we now start a second container (postgres_prod) via Podman, another conmon process will be started:
[podmanager@buildah ~]$ podman run -d -e POSTGRES_PASSWORD=SuperDB --name=postgres_prod postgres
6581a25c82620c725fe1cfb6546479edac856228ecb3c11ad63ab95a453c1b64

[podmanager@buildah ~]$ podman ps
CONTAINER ID IMAGE COMMAND CREATED STATUS PORTS NAMES
6581a25c8262 docker.io/library/postgres:latest postgres 15 seconds ago Up 15 seconds ago postgres_prod
c8b9732b6ad2 docker.io/library/postgres:latest postgres 7 minutes ago Up 7 minutes ago postgres_dev
podmana+ 2209 1 0 13:11 ? Ssl 0:00 /usr/bin/conmon --api-version 1 -c c8b9732b6ad253710ae6e75f934a74e8469e61bc5b5d88c2fa92c7257d00d2e7 -u c8b9732b6ad253710ae6e75f934a74e8469e61bc5b5d88c2fa92c7257d00d2e7 -r /usr/bin/runc -b
232070 2219 2209 0 13:11 ? Ss 0:00 \_ postgres
...
podmana+ 2337 1 0 13:19 ? Ssl 0:00 /usr/bin/conmon --api-version 1 -c 6581a25c82620c725fe1cfb6546479edac856228ecb3c11ad63ab95a453c1b64 -u 6581a25c82620c725fe1cfb6546479edac856228ecb3c11ad63ab95a453c1b64 -r /usr/bin/runc -b
232070 2348 2337 0 13:19 ? Ss 0:00 \_ postgres
...
Here, the UUIDs of the containers can be found in the process.
The cmdline of the process is, of course, much longer than shown here. Below is a complete example, manually formatted:
[podmanager@buildah ~]$ ps -ef f | grep conmon
...
podmana+ 2209 1 0 13:11 ? Ssl 0:00 /usr/bin/conmon
--api-version 1
-c c8b9732b6ad253710ae6e75f934a74e8469e61bc5b5d88c2fa92c7257d00d2e7
-u c8b9732b6ad253710ae6e75f934a74e8469e61bc5b5d88c2fa92c7257d00d2e7
-r /usr/bin/runc
-b /home/podmanager/.local/share/containers/storage/overlay-containers/c8b9732b6ad253710ae6e75f934a74e8469e61bc5b5d88c2fa92c7257d00d2e7/userdata
-p /var/tmp/run-1002/containers/overlay-containers/c8b9732b6ad253710ae6e75f934a74e8469e61bc5b5d88c2fa92c7257d00d2e7/userdata/pidfile
-l k8s-file:/home/podmanager/.local/share/containers/storage/overlay-containers/c8b9732b6ad253710ae6e75f934a74e8469e61bc5b5d88c2fa92c7257d00d2e7/userdata/ctr.log
--exit-dir /var/tmp/run-1002/libpod/tmp/exits
--socket-dir-path /var/tmp/run-1002/libpod/tmp/socket
--log-level error
--runtime-arg --log-format=json
--runtime-arg --log
--runtime-arg=/var/tmp/run-1002/containers/overlay-containers/c8b9732b6ad253710ae6e75f934a74e8469e61bc5b5d88c2fa92c7257d00d2e7/userdata/oci-log
--conmon-pidfile /var/tmp/run-1002/containers/overlay-containers/c8b9732b6ad253710ae6e75f934a74e8469e61bc5b5d88c2fa92c7257d00d2e7/userdata/conmon.pid
--exit-command /usr/bin/podman
--exit-command-arg --root
--exit-command-arg /home/podmanager/.local/share/containers/storage
--exit-command-arg --runroot
--exit-command-arg /var/tmp/run-1002/containers
--exit-command-arg --log-level
--exit-command-arg error
--exit-command-arg --cgroup-manager
--exit-command-arg cgroupfs
--exit-command-arg --tmpdir
--exit-command-arg /var/tmp/run-1002/libpod/tmp
--exit-command-arg --runtime
--exit-command-arg runc
--exit-command-arg --storage-driver
--exit-command-arg overlay
--exit-command-arg --storage-opt
--exit-command-arg overlay.mount_program=/usr/bin/fuse-overlayfs
--exit-command-arg --storage-opt
--exit-command-arg overlay.mount_program=/usr/bin/fuse-overlayfs
--exit-command-arg --events-backend
--exit-command-arg file
--exit-command-arg container
--exit-command-arg cleanup
--exit-command-arg c8b9732b6ad253710ae6e75f934a74e8469e61bc5b5d88c2fa92c7257d00d2e7
...
The formatting clearly shows how parameters are passed between Podman and conmon via *args.
In addition to conmon, an instance of slirp4netns and fuse-overlayfs is also started for each container to provide network and storage without root privileges.
podmana+ 2201 1 0 13:11 ? Ss 0:00 /usr/bin/fuse-overlayfs -o lowerdir=/home/podmanager/.local/share/containers/storage/overlay/l/FX4RZGGJ5HSNVMGVFG6K3I7PIL:/home/podmanager/.local/share/containers/storage/overlay/l/AIHUOS

podmana+ 2206 1 0 13:11 pts/0 S 0:00 /usr/bin/slirp4netns --disable-host-loopback --mtu 65520 --enable-sandbox -c -e 3 -r 4 --netns-type=path /tmp/run-1002/netns/cni-18902a12-5b1b-15d3-0c31-138efe1d66ba tap0

podmana+ 2209 1 0 13:11 ? Ssl 0:00 /usr/bin/conmon --api-version 1 -c c8b9732b6ad253710ae6e75f934a74e8469e61bc5b5d88c2fa92c7257d00d2e7 -u c8b9732b6ad253710ae6e75f934a74e8469e61bc5b5d88c2fa92c7257d00d2e7 -r /usr/bin/runc -b

232070 2219 2209 0 13:11 ? Ss 0:00 \_ postgres
Creating a Systemd Service File
Since containers run without a daemon and can be started individually, it is also natural to control them via Systemd rather than Docker.
However, writing service files is generally tedious, which is why Podman has a built-in function for this.
Below is an example for our postgres_dev
[podmanager@buildah ~]$ podman generate systemd postgres_dev
# container-c8b9732b6ad253710ae6e75f934a74e8469e61bc5b5d88c2fa92c7257d00d2e7.service
# autogenerated by Podman 1.8.2
# Tue Mar 24 13:47:11 CET 2020

[Unit]
Description=Podman container-c8b9732b6ad253710ae6e75f934a74e8469e61bc5b5d88c2fa92c7257d00d2e7.service
Documentation=man:podman-generate-systemd(1)
Wants=network.target
After=network-online.target

[Service]
Environment=PODMAN_SYSTEMD_UNIT=%n
Restart=on-failure
ExecStart=/usr/bin/podman start c8b9732b6ad253710ae6e75f934a74e8469e61bc5b5d88c2fa92c7257d00d2e7
ExecStop=/usr/bin/podman stop -t 10 c8b9732b6ad253710ae6e75f934a74e8469e61bc5b5d88c2fa92c7257d00d2e7
PIDFile=/var/tmp/run-1002/containers/overlay-containers/c8b9732b6ad253710ae6e75f934a74e8469e61bc5b5d88c2fa92c7257d00d2e7/userdata/conmon.pid
KillMode=none
Type=forking

[Install]
WantedBy=multi-user.target default.target
However, there is still one error here. The user under whom the container should be started must be added to the service file, provided this is not to happen as root. To do this, only [Service] needs to be added to the User=podmanager section (or the username on your system).
To register the container as a service under CentOS 8, the following steps would need to be performed:
[podmanager@buildah ~]$ podman generate systemd --files --name postgres_dev
/home/podmanager/container-postgres_dev.service
# User= add to service file
[podmanager@buildah ~]$ sudo cp /home/podmanager/container-postgres_dev.service /etc/systemd/system/
[podmanager@buildah ~]$ sudo systemctl daemon-reload
[podmanager@buildah ~]$ sudo systemctl start container-postgres_dev.service
[podmanager@buildah ~]$ systemctl status container-postgres_dev.service
● container-postgres_dev.service - Podman container-postgres_dev.service
 Loaded: loaded (/etc/systemd/system/container-postgres_dev.service; disabled; vendor preset: disabled)
 Active: active (running) since Tue 2020-03-24 14:04:14 CET; 1s ago
 Docs: man:podman-generate-systemd(1)
 Process: 7691 ExecStart=/usr/bin/podman start postgres_dev (code=exited, status=0/SUCCESS)
 Main PID: 7717 (conmon)
 Tasks: 11 (limit: 25028)
 Memory: 46.7M
 CGroup: /system.slice/container-postgres_dev.service
 ├─7710 /usr/bin/fuse-overlayfs -o lowerdir=/home/podmanager/.local/share/containers/storage/overlay/l/FX4RZGGJ5HSNVMGVFG6K3I7PIL:/home/podmanager/.local/share/containers/storage/overlay/l/AIHUOSIVGT5DN5GCUR7PRELVKK:/home/podma>
 ├─7714 /usr/bin/slirp4netns --disable-host-loopback --mtu 65520 --enable-sandbox -c -e 3 -r 4 --netns-type=path /tmp/run-1002/netns/cni-a0ee9d78-2f8c-a563-1947-92d0766a43b7 tap0
 ├─7717 /usr/bin/conmon --api-version 1 -c c8b9732b6ad253710ae6e75f934a74e8469e61bc5b5d88c2fa92c7257d00d2e7 -u c8b9732b6ad253710ae6e75f934a74e8469e61bc5b5d88c2fa92c7257d00d2e7 -r /usr/bin/runc -b /home/podmanager/.local/share/c>
 ├─7727 postgres
 ├─7758 postgres: checkpointer
 ├─7759 postgres: background writer
 ├─7760 postgres: walwriter
 ├─7761 postgres: autovacuum launcher
 ├─7762 postgres: stats collector
 └─7763 postgres: logical replication launcher

Mär 24 14:04:13 buildah.localdomain systemd[1]: Starting Podman container-postgres_dev.service...
Mär 24 14:04:14 buildah.localdomain podman[7691]: postgres_dev
Mär 24 14:04:14 buildah.localdomain systemd[1]: Started Podman container-postgres_dev.service.
It is important to mention that containers started via Systemd can of course also be managed/accessed via podman, but that starting and stopping should be left to the service.
Creating a Pod
As the name suggests, Podman not only allows creating containers but also organizing them into pods.
Similar to Kubernetes, a pod represents an organizational grouping of containers that can share certain namespaces such as pids, network, or similar.
These are then administered via podman pod $cmd administered.
Below, we will load the image of the postgres-exporter for Prometheus and create a pod named postgres-prod-pod from it.
[podmanager@buildah ~]$ podman pull docker.io/wrouesnel/postgres_exporter

[podmanager@buildah ~]$ podman pod create --name postgres-prod-pod
727e7544515e0e683525e555934e02a341a42009a9c49fb2fd53094187a1e97c

[podmanager@buildah ~]$ podman run -d --pod postgres-prod-pod -e POSTGRES_PASSWORD=SuperDB postgres:latest
8f313260973ef6eb6fa84d2893875213cee89b48c93d08de7642b0a8b03c4a88

[podmanager@buildah ~]$ podman run -d --pod postgres-prod-pod -e DATA_SOURCE_NAME="postgresql://postgres:password@localhost:5432/postgres?sslmode=disable" postgres_exporter
fee22f24ff9b2ace599831fa022fb1261ef836846e0ba938c7b469d8dfb8a48a

[podmanager@buildah ~]$ podman pod ps
POD ID NAME STATUS CREATED # OF CONTAINERS INFRA ID
727e7544515e postgres-prod-pod Running 48 seconds ago 3 6edc862441f1

[podmanager@buildah ~]$ podman pod inspect postgres-prod-pod
{
 "Config": {
 "id": "727e7544515e0e683525e555934e02a341a42009a9c49fb2fd53094187a1e97c",
 "name": "postgres-prod-pod",
 "hostname": "postgres-prod-pod",
 "labels": {

  },
 "cgroupParent": "/libpod_parent",
 "sharesCgroup": true,
 "sharesIpc": true,
 "sharesNet": true,
 "sharesUts": true,
 "infraConfig": {
 "makeInfraContainer": true,
 "infraPortBindings": null
  },
 "created": "2020-03-24T14:44:27.01249721+01:00",
 "lockID": 0
  },
 "State": {
 "cgroupPath": "/libpod_parent/727e7544515e0e683525e555934e02a341a42009a9c49fb2fd53094187a1e97c",
 "infraContainerID": "6edc862441f18234f0c61693f11d946f601973a71b85fa9d777273feed68ed3c",
 "status": "Running"
  },
 "Containers": [
  {
 "id": "6edc862441f18234f0c61693f11d946f601973a71b85fa9d777273feed68ed3c",
 "state": "running"
  },
  {
 "id": "8f313260973ef6eb6fa84d2893875213cee89b48c93d08de7642b0a8b03c4a88",
 "state": "running"
  },
  {
 "id": "fee22f24ff9b2ace599831fa022fb1261ef836846e0ba938c7b469d8dfb8a48a",
  "state": "running"
  }
 ]
}
It can now be seen that the pod contains both the postgres and postgres-exporter containers (compare UUIDs).
The third container is the infra-container for bootstrapping and will not be discussed further here.
In the process list, this appears as follows:
podmana+ 6279 1 0 14:44 ? Ss 0:00 /usr/bin/fuse-overlayfs -o lowerdir=/home/podmanager/.local/share/containers/storage/overlay/l/
podmana+ 6281 1 0 14:44 pts/2 S 0:00 /usr/bin/slirp4netns --disable-host-loopback --mtu 65520 --enable-sandbox -c -e 3 -r 4 --netns-type=path /tmp/run-1002/netns/cni-5fe4356e-77c0-8127-f72b-7335c2ed05c4 tap0
podmana+ 6284 1 0 14:44 ? Ssl 0:00 /usr/bin/conmon --api-version 1 -c 6edc862441f18234f0c61693f11d946f601973a71b85fa9d777273feed68ed3c -u 6edc862441f18234f0c61693f11d946f601973a71b85fa9d777273feed68ed3c -r /usr/bin/runc -b
podmana+ 6296 6284 0 14:44 ? Ss 0:00 \_ /pause
podmana+ 6308 1 0 14:44 ? Ss 0:00 /usr/bin/fuse-overlayfs -o lowerdir=/home/podmanager/.local/share/containers/storage/overlay/l/FX4RZGGJ5HSNVMGVFG6K3I7PIL:/home/podmanager/.local/share/containers/storage/overlay/l/AIHUOS
podmana+ 6312 1 0 14:44 ? Ssl 0:00 /usr/bin/conmon --api-version 1 -c 8f313260973ef6eb6fa84d2893875213cee89b48c93d08de7642b0a8b03c4a88 -u 8f313260973ef6eb6fa84d2893875213cee89b48c93d08de7642b0a8b03c4a88 -r /usr/bin/runc -b
232070 6322 6312 0 14:44 ? Ss 0:00 \_ postgres
...
232070 6549 6322 0 14:44 ? Ss 0:00 \_ postgres: postgres postgres ::1(51290) idle
podmana+ 6520 1 0 14:44 ? Ss 0:00 /usr/bin/fuse-overlayfs -o lowerdir=/home/podmanager/.local/share/containers/storage/overlay/l/P5NJW4TB6JUFOBBIN2MOHW7272:/home/podmanager/.local/share/containers/storage/overlay/l/KVC54Z
podmana+ 6523 1 0 14:44 ? Ssl 0:00 /usr/bin/conmon --api-version 1 -c fee22f24ff9b2ace599831fa022fb1261ef836846e0ba938c7b469d8dfb8a48a -u fee22f24ff9b2ace599831fa022fb1261ef836846e0ba938c7b469d8dfb8a48a -r /usr/bin/runc -b
251072 6534 6523 0 14:44 ? Ssl 0:00 \_ /postgres_exporter
Here you can see that although there are several conmon and overlayfs processes for the containers, there is only one slirp4netns, as the containers share this and can also communicate via localhost.
You can also see that the PostgreSQL® database has a connection from localhost (PID 6549), which is the exporter.
Normally, when creating a pod via podman pod create, the following namespaces are grouped for the containers: net, ipc, uts, and user.
Thus, each container still has its own PID namespace despite being grouped in the pod.
However, if this is desired, the parameter --share can be used during creation to specify what should be shared.
For example, this is what the process list of the pod without a shared PID namespace looks like. Each container has its own process structure.
[podmanager@buildah ~]$ podman pod top postgres-prod-pod
USER PID PPID %CPU ELAPSED TTY TIME COMMAND
0 1 0 0.000 11m45.845291911s ? 0s /pause
postgres 1 0 0.000 11m45.854330176s ? 0s postgres
postgres 25 1 0.000 11m45.854387876s ? 0s postgres: checkpointer
postgres 26 1 0.000 11m45.854441615s ? 0s postgres: background writer
postgres 27 1 0.000 11m45.854483844s ? 0s postgres: walwriter
postgres 28 1 0.000 11m45.854525645s ? 0s postgres: autovacuum launcher
postgres 29 1 0.000 11m45.854567082s ? 0s postgres: stats collector
postgres 30 1 0.000 11m45.854613262s ? 0s postgres: logical replication launcher
postgres 31 1 0.000 11m45.854653703s ? 0s postgres: postgres postgres ::1(51292) idle
postgres_exporter 1 0 0.000 11m45.859505449s ? 0s /postgres_exporter
As an alternative, the output when creating the pod using podman pod create --name postgres-prod-pod --share=pid,net,ipc,uts,user
[podmanager@buildah ~]$ podman pod top postgres-prod-pod
USER PID PPID %CPU ELAPSED TTY TIME COMMAND
root 1 0 0.000 20.396867487s ? 0s /pause
postgres 6 0 0.000 20.396936905s pts/0 0s postgres
postgres 60 6 0.000 18.396997034s ? 0s postgres: checkpointer
postgres 61 6 0.000 18.397086198s ? 0s postgres: background writer
postgres 62 6 0.000 18.39713465s ? 0s postgres: walwriter
postgres 63 6 0.000 18.39718056s ? 0s postgres: autovacuum launcher
postgres 64 6 0.000 18.397229737s ? 0s postgres: stats collector
postgres 65 6 0.000 18.397279102s ? 0s postgres: logical replication launcher
20001 66 0 0.000 16.397325377s pts/0 0s /postgres_exporter
Available options for --share are ipc, net, pid, user, and uts.
The entire pod can now also be started and stopped via podman pod stop/start.
Similarly, systemd service files can be generated for pods as well as containers.
Podman and Kubernetes
Podman offers some support in the area of Kubernetes YAML.
For example, it is possible to generate Kubernetes Pod YAML from pods created with Podman.
[podmanager@buildah ~]$ podman generate kube postgres-prod-pod -f postgres-prod-pod.yaml
[podmanager@buildah ~]$ cat postgres-prod-pod.yaml
# Generation of Kubernetes YAML is still under development!
#
# Save the output of this file and use kubectl create -f to import
# it into Kubernetes.
#
# Created with podman-1.8.2
apiVersion: v1
kind: Pod
metadata:
 creationTimestamp: "2020-03-24T14:08:14Z"
 labels:
 app: postgres-prod-pod
 name: postgres-prod-pod
spec:
 containers:
 - command:
 - postgres
 env:
  ...
 image: docker.io/library/postgres:latest
 name: reverentptolemy
 resources: {}
 securityContext:
 allowPrivilegeEscalation: true
 capabilities: {}
 privileged: false
 readOnlyRootFilesystem: false
 seLinuxOptions: {}
 workingDir: /
 - env:
  ...
 image: docker.io/wrouesnel/postgres_exporter:latest
 name: friendlyshirley
  resources: {}
  securityContext:
  allowPrivilegeEscalation: true
  capabilities: {}
  privileged: false
  readOnlyRootFilesystem: false
 runAsGroup: 20001
 runAsUser: 20001
  seLinuxOptions: {}
  workingDir: /
status: {}
With the -s option, a service with potentially published ports is even generated:
---
apiVersion: v1
kind: Service
metadata:
 creationTimestamp: "2020-03-24T14:10:42Z"
  labels:
  app: postgres-prod-pod
  name: postgres-prod-pod
spec:
 selector:
  app: postgres-prod-pod
 type: NodePort
status:
 loadBalancer: {}
The generate-yaml functionality applies to both pods and services, and in both directions.
With podman play, it is possible to test pod and container definitions in Podman.
Conclusion
This was a brief overview of the possibilities for running containers without a daemon and root privileges on a host.
Of course, much more is possible with Podman, but explaining every option here would go beyond the scope.
It is perhaps also worth mentioning that Podman with cgroupsV2 enabled can also evaluate resource usage in pods, for example.
However, this is currently only enabled by default under Fedora 31.
Patroni is a clustering solution for PostgreSQL® that is getting more and more popular in the cloud and Kubernetes sector due to its operator pattern and integration with Etcd or Consul. Some time ago we wrote a blog post about the integration of Patroni into Debian. Recently, the vip-manager project which is closely related to Patroni has been uploaded to Debian by us. We will present vip-manager and how we integrated it into Debian in the following.
To recap, Patroni uses a distributed consensus store (DCS) for leader-election and failover. The current cluster leader periodically updates its leader-key in the DCS. As soon the key cannot be updated by Patroni for whatever reason it becomes stale. A new leader election is then initiated among the remaining cluster nodes.
PostgreSQL Client-Solutions for High-Availability
From the user’s point of view it needs to be ensured that the application is always connected to the leader, as no write transactions are possible on the read-only standbys. Conventional high-availability solutions like Pacemaker utilize virtual IPs (VIPs) that are moved to the primary node in the case of a failover.
For Patroni, such a mechanism did not exist so far. Usually, HAProxy (or a similar solution) is used which does periodic health-checks on each node’s Patroni REST-API and routes the client requests to the current leader.
An alternative is client-based failover (which is available since PostgreSQL 10), where all cluster members are configured in the client connection string. After a connection failure the client tries each remaining cluster member in turn until it reaches a new primary.
vip-manager
A new and comfortable approach to client failover is vip-manager. It is a service written in Go that gets started on all cluster nodes and connects to the DCS. If the local node owns the leader-key, vip-manager starts the configured VIP. In case of a failover, vip-manager removes the VIP on the old leader and the corresponding service on the new leader starts it there. The clients are configured for the VIP and will always connect to the cluster leader.
Debian-Integration of vip-manager
For Debian, the pg_createconfig_patroni program from the Patroni package has been adapted so that it can now create a vip-manager configuration:
pg_createconfig_patroni 11 test --vip=10.0.3.2
Similar to Patroni, we start the service for each instance:
systemctl start vip-manager@11-test
The output of patronictl shows that pg1 is the leader:
+---------+--------+------------+--------+---------+----+-----------+
| Cluster | Member |    Host    |  Role  |  State  | TL | Lag in MB |
+---------+--------+------------+--------+---------+----+-----------+
| 11-test |  pg1   | 10.0.3.247 | Leader | running |  1 |           |
| 11-test |  pg2   | 10.0.3.94  |        | running |  1 |         0 |
| 11-test |  pg3   | 10.0.3.214 |        | running |  1 |         0 |
+---------+--------+------------+--------+---------+----+-----------+
In journal of ‘pg1’ it can be seen that the VIP has been configured:
Jan 19 14:53:38 pg1 vip-manager[9314]: 2020/01/19 14:53:38 IP address 10.0.3.2/24 state is false, desired true
Jan 19 14:53:38 pg1 vip-manager[9314]: 2020/01/19 14:53:38 Configuring address 10.0.3.2/24 on eth0
Jan 19 14:53:38 pg1 vip-manager[9314]: 2020/01/19 14:53:38 IP address 10.0.3.2/24 state is true, desired true
If LXC containers are used, one can also see the VIP in the output of lxc-ls -f:
NAME    STATE   AUTOSTART GROUPS IPV4                 IPV6 UNPRIVILEGED
pg1     RUNNING 0         -      10.0.3.2, 10.0.3.247 -    false
pg2     RUNNING 0         -      10.0.3.94            -    false
pg3     RUNNING 0         -      10.0.3.214           -    false
The vip-manager packages are available for Debian testing (bullseye) and unstable, as well as for the upcoming 20.04 LTS Ubuntu release (focal) in the official repositories. For Debian stable (buster), as well as for Ubuntu 19.04 and 19.10, packages are available at apt.postgresql.org maintained by credativ, along with the updated Patroni packages with vip-manager integration.
Switchover Behaviour
In case of a planned switchover, e.g. pg2 becomes the new leader:
# patronictl -c /etc/patroni/11-test.yml switchover --master pg1 --candidate pg2 --force
Current cluster topology
+---------+--------+------------+--------+---------+----+-----------+
| Cluster | Member |    Host    |  Role  |  State  | TL | Lag in MB |
+---------+--------+------------+--------+---------+----+-----------+
| 11-test |  pg1   | 10.0.3.247 | Leader | running |  1 |           |
| 11-test |  pg2   | 10.0.3.94  |        | running |  1 |         0 |
| 11-test |  pg3   | 10.0.3.214 |        | running |  1 |         0 |
+---------+--------+------------+--------+---------+----+-----------+
2020-01-19 15:35:32.52642 Successfully switched over to "pg2"
+---------+--------+------------+--------+---------+----+-----------+
| Cluster | Member |    Host    |  Role  |  State  | TL | Lag in MB |
+---------+--------+------------+--------+---------+----+-----------+
| 11-test |  pg1   | 10.0.3.247 |        | stopped |    |   unknown |
| 11-test |  pg2   | 10.0.3.94  | Leader | running |  1 |           |
| 11-test |  pg3   | 10.0.3.214 |        | running |  1 |         0 |
+---------+--------+------------+--------+---------+----+-----------+
The VIP has now been moved to the new leader:
NAME    STATE   AUTOSTART GROUPS IPV4                 IPV6 UNPRIVILEGED
pg1     RUNNING 0         -      10.0.3.247          -    false
pg2     RUNNING 0         -      10.0.3.2, 10.0.3.94 -    false
pg3     RUNNING 0         -      10.0.3.214          -    false
This can also be seen in the journals, both from the old leader:
Jan 19 15:35:31 pg1 patroni[9222]: 2020-01-19 15:35:31,634 INFO: manual failover: demoting myself
Jan 19 15:35:31 pg1 patroni[9222]: 2020-01-19 15:35:31,854 INFO: Leader key released
Jan 19 15:35:32 pg1 vip-manager[9314]: 2020/01/19 15:35:32 IP address 10.0.3.2/24 state is true, desired false
Jan 19 15:35:32 pg1 vip-manager[9314]: 2020/01/19 15:35:32 Removing address 10.0.3.2/24 on eth0
Jan 19 15:35:32 pg1 vip-manager[9314]: 2020/01/19 15:35:32 IP address 10.0.3.2/24 state is false, desired false
As well as from the new leader pg2:
Jan 19 15:35:31 pg2 patroni[9229]: 2020-01-19 15:35:31,881 INFO: promoted self to leader by acquiring session lock
Jan 19 15:35:31 pg2 vip-manager[9292]: 2020/01/19 15:35:31 IP address 10.0.3.2/24 state is false, desired true
Jan 19 15:35:31 pg2 vip-manager[9292]: 2020/01/19 15:35:31 Configuring address 10.0.3.2/24 on eth0
Jan 19 15:35:31 pg2 vip-manager[9292]: 2020/01/19 15:35:31 IP address 10.0.3.2/24 state is true, desired true
Jan 19 15:35:32 pg2 patroni[9229]: 2020-01-19 15:35:32,923 INFO: Lock owner: pg2; I am pg2
As one can see, the VIP is moved within one second.
Updated Ansible Playbook
Our Ansible-Playbook for the automated setup of a three-node cluster on Debian has also been updated and can now configure a VIP if so desired:
# ansible-playbook -i inventory -e vip=10.0.3.2 patroni.yml
Questions and Help
Do you have any questions or need help? Feel free to write to info@credativ.com.
There are two ways to authenticate yourself as a client to Icinga2. On the one hand there is the possibility to authenticate yourself by username and password. The other option is authentication using client certificates. With the automated query of the Icinga2 API, the setup of client certificates is not only safety-technically advantageous, but also in the implementation on the client side much more practical.
Unfortunately, the official Icinga2 documentation does not provide a description of the exact certificate creation process. Therefore here is a short manual:
After installing Icinga2 the API feature has to be activated first:
icinga2 feature enable api
The next step is to configure the Icinga2-node as master, the easiest way to do this is with the “node-wizard” program:
icinga2 node wizard
Icinga2 creates the necessary CA certificates with which the client certificates still to be created must be signed. Now the client certificate is created:
icinga2 pki new-cert --cn --key .key --csr .csr
The parameter cn stands for the so-called common-name. This is the name used in the Icinga2 user configuration to assign the user certificate to the user. Usually the common name is the FQDN. In this scenario, however, this name is freely selectable. All other names can also be freely chosen, but it is recommended to use a name that suggests that the three files belong together.
Now the certificate has to be signed by the CA, Icinga2:
icinga2 pki sign-csr --csr .csr --cert .crt
Finally, the API user must be created in the file “api-user.conf”. This file is located in the subfolder of each Icinga2 configuration:
object ApiUser {
client_cn =
permissions = []
}
For a detailed explanation of the user’s assignment of rights, it is worth taking a look at the documentation.
Last but not least Icinga2 has to be restarted. Then the user can access the Icinga2 API without entering a username and password, if he passes the certificates during the query.
You can read up on the services we provide for Icinga2 righthere.
This post was originally written by Bernd Borowski.
One would think that microcode updates are basically unproblematic on modern Linux distributions. This is fundamentally correct. Nevertheless, there are always edge cases in which distribution developers may have missed something.
Using the example of Ubuntu 18.04 LTS “Bionic Beaver” in connection with the XEN Hypervisor this becomes obvious when it comes to processors microcode updates.
Ubuntu delivers updated microcode packages for both AMD and Intel. However, these are apparently not applied to the processor.
XEN Microkernel
The reason for this is not to obvious. In XEN, the host system is already paravirtualized and cannot directly influence the CPU for security reasons. Accordingly, manual attempts to change the current microcode fail.
Therefore, the XEN microkernel has to take care of the microcode patching. Instructed correctyl, it will do so at boot time.
Customize command line in Grub
For the XEN kernel to patch the microcode of the CPU, it must have access to the microcode code files at boot time and on the other hand, he must also have the order to apply them. We can achieve the latter by Grub boot loader configuration. To do so, we setup a parameter in the kernel command line.
In the case of Ubuntu 18.04 LTS, the grub configuration file can be found at /etc/default/grub.
There you should find the file xen.cfg. This is of course only the case if the XEN Hypervisor package is installed. Open the config file in your editor and look for the location of the variable GRUB_CMDLINE_XEN_DEFAULT. Add the parameter ucode=scan. In the default state, the line of the xen.cfg then should look like this:
GRUB_CMDLINE_XEN_DEFAULT="ucode=scan"
Customize Initramfs
In addition to the instruction, the microkernel of the XEN hypervisor also needs access to the respective microcode files as well as the ‘Intel Microcode Tool’, if applicable.
While the microcode packages are usually already installed correctly, the the Intel tool may had to be made accessible via sudo apt-get install iucode tool. Care must also be taken to ensure that the microcode files also get into the initial ramdisk. For this purpose, Ubuntu already has matching scripts available.
In the default state, the system tries to select the applicable microcodes for the CPU in the InitramFS. Unfortunately, this does not succeed always, so you might have to help here.
With the command sudo lsinitrd /boot/initrd.img-4.15.0-46-generic you can, for example, check which contents are stored in the InitramFS with the name initrd.img-4.15.0-46-generic. If on an Intel system there is something from AMD but not Intel shown, the automatic processor detection went wrong when creating the initramdisk.
To get this right, you need to look at the files amd64-microcode and intel-microcode in the directory /etc/default. Each of these two config files has a INITRAMFS variable AMD64UCODE_INITRAMFS or IUCODE_TOOL_INITRAMFS. The valid values to configure are “no,” “auto,” or “early”. Default is “auto”. With “auto” the system tries the auto discovery mentioned above. If it doesn’t work, you should set the value to early in the file matching the manufacturer of your CPU, and the other setup file to no. If the manufacturer is Intel, you can use the file intel-microcode to set the following additional variable:
IUCODE_TOOL_SCANCPUS=yes
This causes the script set to perform advanced CPU detection based on the Intel CPU, so that only the microcode files are included in the InitramFS that match the CPU. This helps avoiding an oversized initial ramdisk.
Finalize changes
Both the changes to the grub config and the adjustments to the InitramFS must also be finalized. This is done via
sudo update-initramfs -u
sudo update-grub
A subsequent restart of the hypervisor will then let the XEN microkernel integrate the microcode patches provided in the InitramFS to the CPU.
Is it worth the effort?
Adjustments to the microcode of the processors are important. CPU manufacturers troubleshoot the “hardware” they sell. This fixes can be very important to maintain the integrity oder security of your server system – as we saw last year when the Spectre and Meltdown bugs got undisclosed. Of course, microcode updates can also be seen as negative, since the fixes for “Spectre” as well as “Meltdown” impose performance losses. Here it is necessary to consider whether one should integrate the microcode updates or not. This depends on risk vs. reward. Here there are quite different views, which are to be considered in the context of the system application.
A virtualization host, which runs third party virtual machines has whole other security requirements than a hypervisor who is deeply digged into the internal infrastructure and only runs trusted VMs. Between these two extremes, there are, of course, a few shades to deal with.
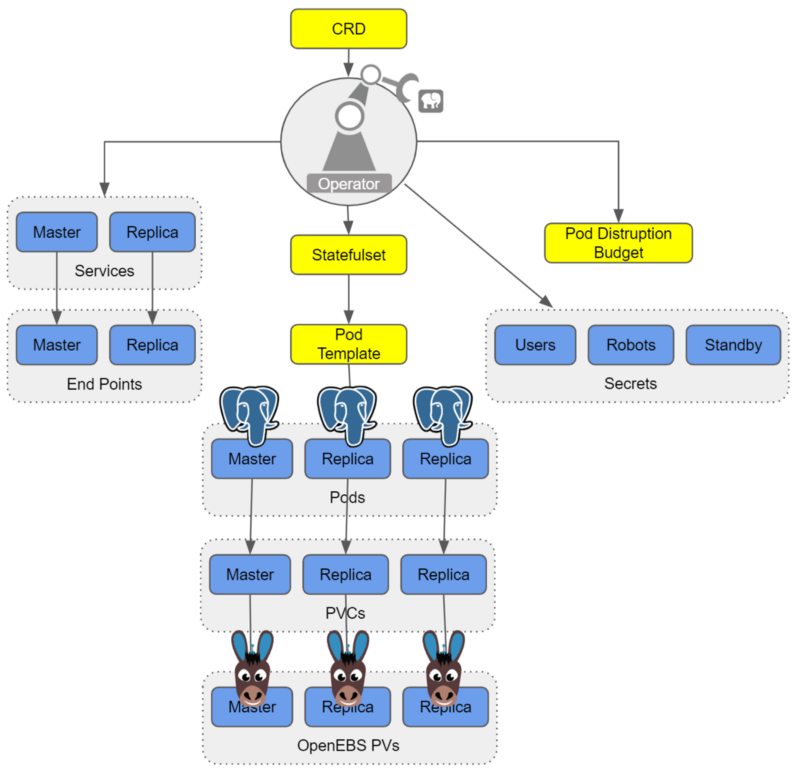
In this article, we look at running PostgreSQL® in a highly available setup in a Kubernetes environment—a topic that is certainly of particular interest to many of our PostgreSQL® users.
Together with our partner company MayaData, we demonstrate below the use cases and benefits of the extremely powerful open-source project OpenEBS.
OpenEBS is a freely available storage management system whose development is supported and guided by MayaData.
We would like to extend our special thanks to Murat-Karslioglu from MayaData and our colleague Adrian Vondendriesch for this interesting and helpful article, which the colleagues have, of course, written in English this time due to the international collaboration.
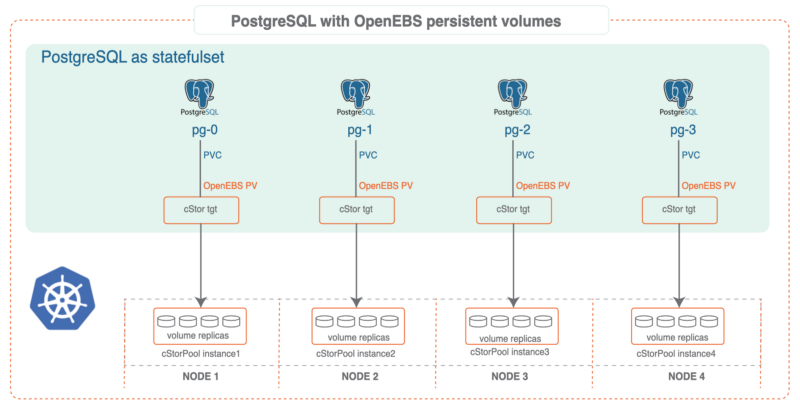
PostgreSQL® anywhere — via Kubernetes with some help from OpenEBS and credativ engineering
by Murat Karslioglu, OpenEBS and Adrian Vondendriesch, credativ
Introduction
If you are already running Kubernetes on some form of cloud whether on-premises or as a service, you understand the ease-of-use, scalability and monitoring benefits of Kubernetes — and you may well be looking at how to apply those benefits to the operation of your databases.
PostgreSQL® remains a preferred relational database, and although setting up a highly available Postgres cluster from scratch might be challenging at first, we are seeing patterns emerging that allow PostgreSQL® to run as a first class citizen within Kubernetes, improving availability, reducing management time and overhead, and limiting cloud or data center lock-in.
There are many ways to run high availability with PostgreSQL®; for a list, see the PostgreSQL® Documentation. Some common cloud-native Postgres cluster deployment projects include Crunchy Data’s, Sorint.lab’s Stolon and Zalando’s Patroni/Spilo. Thus far we are seeing Zalando’s operator as a preferred solution in part because it seems to be simpler to understand and we’ve seen it operate well.
Some quick background on your authors:
- OpenEBS is a broadly deployed OpenSource storage and storage management project sponsored by MayaData.
- credativ is a leading open source support and engineering company with particular depth in PostgreSQL®.
In this blog, we’d like to briefly cover how using cloud-native or “container attached” storage can help in the deployment and ongoing operations of PostgreSQL® on Kubernetes. This is the first of a series of blogs we are considering — this one focuses more on why users are adopting this pattern and future ones will dive more into the specifics of how they are doing so.
At the end you can see how to use a Storage Class and a preferred operator to deploy PostgreSQL® with OpenEBS underlying
If you are curious about what container attached storage of CAS is you can read more from the Cloud Native Computing Foundation (CNCF) here.
Conceptually you can think of CAS as being the decomposition of previously monolithic storage software into containerized microservices that themselves run on Kubernetes. This gives all the advantages of running Kubernetes that already led you to run Kubernetes — now applied to the storage and data management layer as well. Of special note is that like Kubernetes, OpenEBS runs anywhere so the same advantages below apply whether on on-premises or on any of the many hosted Kubernetes services.
PostgreSQL® plus OpenEBS
We have seen joint users adopting OpenEBS as a substrate to PostgreSQL® for a variety of reasons. A few that jump out include:
Consistency in underlying disk or cloud volume management:
One of the most annoying things about setting up a system to run PostgreSQL® — even if it is on Kubernetes — is configuring the underlying disks and storage systems as needed. With a solution like OpenEBS, you specify via storage classes how you want the underlying systems configured and OpenEBS with the help of Kubernetes ensures that the system delivers the storage capacity that is needed and that it is configured as you need it. An example of such a storage class is shared below. This automation can remove a source of human error and definitely removes a source of human annoyance.
Thin provisioning and on-demand expansion:
Now that you have turned over to OpenEBS the provisioning and management of the underlying storage hardware and services, you just have to tell it the amount of storage you need for your PostgreSQL® and then everything will work out well, right? Well actually knowing how much data your PostgreSQL® instance or instances will consume is pretty tricky — and arguably somewhat impossible as it is beyond your control.
Here OpenEBS can also help because it supports both thin provisioning and on the fly pool expansion. The thin provisioning allows you to claim more space than you actually can provisioning — this then allows your PostgreSQL® to scale in the usage of space without interruption by allowing for adding more storage to the running system without the need to stop the database.
Thin provisioning though is not a good idea if there is not also on the fly expansion of the underlying capacity for perhaps obvious reasons — as the PostgreSQL® expands you want to make sure it can claim space as needed otherwise at some point you’ll have to interrupt operations and again perform manual tasks. OpenEBS helps here as well — if configured to do so it can expand its underlying pools, whether these are of physical disks, underlying storage systems, or storage services from a cloud. The capacity of the pool can be expanded on demand simply by adding more disks to the cStor pool.
The cStor architecture also supports the resizing of a provisioned volume on the fly and this will be fully automated as of OpenEBS 0.9. Via these enhancements, volumes, as well as underlying pools, will be able to scale automatically on any cloud providing K8s support.
In addition to reducing the risk and hassle of manual operations, the combination of thin provisioning and on-demand scaling can reduce costs because you don’t over-provision capacity to achieve performance for example, which reduces unnecessary cloud service spending and can increase average utilization of usage of your hardware as well.
Disaster recovery and migration:
With a solution like OpenEBS, your storage classes can also include back-up schedules — and these can be easily managed either via Kubectl or via the free to use MayaOnline. Again these storage classes can be applied on a per container basis which is quite a bit of granularity and control by each team running their PostgreSQL®.
Additionally, we are working together to add tighter integration with PostgreSQL® to this per snapshot based workload, per container back-up capability, which is called DMaaS by MayaData and OpenEBS. With this additional integration, an option will be added to the storage classes and to OpenEBS to flush active transactions before taking the snapshot. The additional integration of storage snapshots in conjunction with Write Ahead Log (WAL) archiving will provide additional PITR functionality. DMaaS leverages the open source Velero from Heptio and marries it to the COW based capabilities of the cStor OpenEBS engine to deliver extremely efficient backups and migrations.
With DMaaS backups taken to one location can be recovered from another. This can prove useful for a variety of use cases including the use of relatively ephemeral clusters as a part of a rolling upgrade for example of an environment. Additionally, the same capability can be used to move workloads from one Kubernetes environment to another thereby reducing lock-in.
Snapshots and clones for development and troubleshooting:
DBAs have been using snapshots and clones for a long time to assist in troubleshooting and to enable teams to develop and test against a read-only copy of production data. For example, via OpenEBS you can easily use Kubernetes to invoke a snapshot and then promote that snapshot to a clone and then spawn a container from that clone. You now can do anything you want with that container and the data set contained within it, and of course, destroy it when you are done.
One use case that clones can support is improved reporting. For example, let’s say you do computationally expensive analytical queries and build roll-up queries for monthly reports. It is simple with OpenEBS to clone the underlying OLTP system, allowing you to work on a static copy of your database, thereby removing load from your production DBs and ensuring you have a verifiable source of information for those reports.
Closing the loop with per workload visibility and optimization:
In addition to the benefits of using OpenEBS, there are additional benefits from using MayaOnline for the management of stateful workloads. We may address these in future blogs examining common day 2 operations and optimization of your PostgreSQL® on Kubernetes.
Running Postgres-Operator on OpenEBS
Software Prerequisites
- Postgres-Operator (for cluster deployment)
- Docker installed
- Kubernetes 1.9+ cluster installed
- kubectl installed
- OpenEBS installed
Install OpenEBS
- If OpenEBS is not installed in your K8s cluster, this can be done from here. If OpenEBS is already installed, go to the next step.
- Connect to MayaOnline (Optional): Connecting the Kubernetes cluster to MayaOnline provides good visibility of storage resources. MayaOnline has various support options for enterprise customers.
Configure cStor Pool
- If cStor Pool is not configured in your OpenEBS cluster, this can be done from here. As PostgreSQL® is a StatefulSet application, it requires a single storage replication factor. If you prefer additional redundancy you can always increase the replica count to 3.
During cStor Pool creation, make sure that the maxPools parameter is set to >=3. If a cStor pool is already configured, go to the next step. Sample YAML named openebs-config.yaml for configuring cStor Pool is provided in the Configuration details below.
openebs-config.yaml
#Use the following YAMLs to create a cStor Storage Pool.
# and associated storage class.
apiVersion: openebs.io/v1alpha1
kind: StoragePoolClaim
metadata:
 name: cstor-disk
spec:
 name: cstor-disk
 type: disk
 poolSpec:
 poolType: striped
 # NOTE — Appropriate disks need to be fetched using `kubectl get disks`

#
 # `Disk` is a custom resource supported by OpenEBS with `node-disk-manager`
 # as the disk operator
# Replace the following with actual disk CRs from your cluster `kubectl get disks`
# Uncomment the below lines after updating the actual disk names.
 disks:
 diskList:
# Replace the following with actual disk CRs from your cluster from `kubectl get disks`
# — disk-184d99015253054c48c4aa3f17d137b1
# — disk-2f6bced7ba9b2be230ca5138fd0b07f1
# — disk-806d3e77dd2e38f188fdaf9c46020bdc
# — disk-8b6fb58d0c4e0ff3ed74a5183556424d
# — disk-bad1863742ce905e67978d082a721d61
# — disk-d172a48ad8b0fb536b9984609b7ee653
 — -
Create Storage Class
- You must configure a StorageClass to provision cStor volume on a cStor pool. In this solution, we are using a StorageClass to consume the cStor Pool which is created using external disks attached on the Nodes. The storage pool is created using the steps provided in the Configure StoragePool section. In this solution, PostgreSQL® is a deployment. Since it requires replication at the storage level the cStor volume replicaCount is 3. Sample YAML named openebs-sc-pg.yaml to consume cStor pool with cStorVolume Replica count as 3 is provided in the configuration details below.
openebs-sc-pg.yaml
apiVersion: storage.k8s.io/v1
kind: StorageClass
metadata:
 name: openebs-postgres
 annotations:
 openebs.io/cas-type: cstor
 cas.openebs.io/config: |
 - name: StoragePoolClaim
 value: "cstor-disk"
 - name: ReplicaCount
 value: "3"
provisioner: openebs.io/provisioner-iscsi
reclaimPolicy: Delete
---
Launch and test Postgres Operator
- Clone Zalando’s Postgres Operator.
git clone https://github.com/zalando/postgres-operator.git
cd postgres-operator
Use the OpenEBS storage class
- Edit manifest file and add openebs-postgres as the storage class.
nano manifests/minimal-postgres-manifest.yaml
After adding the storage class, it should look like the example below:
apiVersion: "acid.zalan.do/v1"
kind: postgresql
metadata:
 name: acid-minimal-cluster
 namespace: default
spec:
 teamId: "ACID"
 volume:
 size: 1Gi
 storageClass: openebs-postgres
 numberOfInstances: 2
 users:
 # database owner
 zalando:
 - superuser
 - createdb

# role for application foo
 foo_user: []

#databases: name->owner
 databases:
 foo: zalando
 postgresql:
 version: "10"
 parameters:
 shared_buffers: "32MB"
 max_connections: "10"
 log_statement: "all"
Start the Operator
- Run the command below to start the operator
kubectl create -f manifests/configmap.yaml # configuration
kubectl create -f manifests/operator-service-account-rbac.yaml # identity and permissions
kubectl create -f manifests/postgres-operator.yaml # deployment
Create a Postgres cluster on OpenEBS
Optional: The operator can run in a namespace other than default. For example, to use the test namespace, run the following before deploying the operator’s manifests:
kubectl create namespace test
kubectl config set-context $(kubectl config current-context) — namespace=test
- Run the command below to deploy from the example manifest:
kubectl create -f manifests/minimal-postgres-manifest.yaml
2. It only takes a few seconds to get the persistent volume (PV) for the pgdata-acid-minimal-cluster-0 up. Check PVs created by the operator using the kubectl get pv command:
$ kubectl get pv
NAME CAPACITY ACCESS MODES RECLAIM POLICY STATUS CLAIM STORAGECLASS REASON AGE
pvc-8852ceef-48fe-11e9–9897–06b524f7f6ea 1Gi RWO Delete Bound default/pgdata-acid-minimal-cluster-0 openebs-postgres 8m44s
pvc-bfdf7ebe-48fe-11e9–9897–06b524f7f6ea 1Gi RWO Delete Bound default/pgdata-acid-minimal-cluster-1 openebs-postgres 7m14s
Connect to the Postgres master and test
- If it is not installed previously, install psql client:
sudo apt-get install postgresql-client
2. Run the command below and note the hostname and host port.
kubectl get service — namespace default |grep acid-minimal-cluster
3. Run the commands below to connect to your PostgreSQL® DB and test. Replace the [HostPort] below with the port number from the output of the above command:
export PGHOST=$(kubectl get svc -n default -l application=spilo,spilo-role=master -o jsonpath="{.items[0].spec.clusterIP}")
export PGPORT=[HostPort]
export PGPASSWORD=$(kubectl get secret -n default postgres.acid-minimal-cluster.credentials -o ‘jsonpath={.data.password}’ | base64 -d)
psql -U postgres -c ‘create table foo (id int)’
Congrats you now have the Postgres-Operator and your first test database up and running with the help of cloud-native OpenEBS storage.
Partnership and future direction
As this blog indicates, the teams at MayaData / OpenEBS and credativ are increasingly working together to help organizations running PostgreSQL® and other stateful workloads. In future blogs, we’ll provide more hands-on tips.
We are looking for feedback and suggestions on where to take this collaboration. Please provide feedback below or find us on Twitter or on the OpenEBS slack community.
Patroni is a PostgreSQL high availability solution with a focus on containers and Kubernetes. Until recently, the available Debian packages had to be configured manually and did not integrate well with the rest of the distribution. For the upcoming Debian 10 “Buster” release, the Patroni packages have been integrated into Debian’s standard PostgreSQL framework by credativ. They now allow for an easy setup of Patroni clusters on Debian or Ubuntu.
Patroni employs a “Distributed Consensus Store” (DCS) like Etcd, Consul or Zookeeper in order to reliably run a leader election and orchestrate automatic failover. It further allows for scheduled switchovers and easy cluster-wide changes to the configuration. Finally, it provides a REST interface that can be used together with HAProxy in order to build a load balancing solution. Due to these advantages Patroni has gradually replaced Pacemaker as the go-to open-source project for PostgreSQL high availability.
However, many of our customers run PostgreSQL on Debian or Ubuntu systems and so far Patroni did not integrate well into those. For example, it does not use the postgresql-common framework and its instances were not displayed in pg_lsclusters output as usual.
Integration into Debian
In a collaboration with Patroni lead developer Alexander Kukushkin from Zalando the Debian Patroni package has been integrated into the postgresql-common framework to a large extent over the last months. This was due to changes both in Patroni itself as well as additional programs in the Debian package. The current Version 1.5.5 of Patroni contains all these changes and is now available in Debian “Buster” (testing) in order to setup Patroni clusters.
The packages are also available on apt.postgresql.org and thus installable on Debian 9 “Stretch” and Ubuntu 18.04 “Bionic Beaver” LTS for any PostgreSQL version from 9.4 to 11.
The most important part of the integration is the automatic generation of a suitable Patroni configuration with the pg_createconfig_patroni command. It is run similar to pg_createcluster with the desired PostgreSQL major version and the instance name as parameters:
pg_createconfig_patroni 11 test
This invocation creates a file /etc/patroni/11-test.yml, using the DCS configuration from /etc/patroni/dcs.yml which has to be adjusted according to the local setup. The rest of the configuration is taken from the template /etc/patroni/config.yml.in which is usable in itself but can be customized by the user according to their needs. Afterwards the Patroni instance is started via systemd similar to regular PostgreSQL instances:
systemctl start patroni@11-test
A simple 3-node Patroni cluster can be created and started with the following few commands, where the nodes pg1, pg2 and pg3 are considered to be hostnames and the local file dcs.yml contains the DCS configuration:
for i in pg1 pg2 pg3; do ssh $i 'apt -y install postgresql-common'; done
for i in pg1 pg2 pg3; do ssh $i 'sed -i "s/^#create_main_cluster = true/create_main_cluster = false/" /etc/postgresql-common/createcluster.conf'; done
for i in pg1 pg2 pg3; do ssh $i 'apt -y install patroni postgresql'; done
for i in pg1 pg2 pg3; do scp ./dcs.yml $i:/etc/patroni; done
for i in pg1 pg2 pg3; do ssh @$i 'pg_createconfig_patroni 11 test' && systemctl start patroni@11-test'; done
Afterwards, you can get the state of the Patroni cluster via
ssh pg1 'patronictl -c /etc/patroni/11-patroni.yml list'
+---------+--------+------------+--------+---------+----+-----------+
| Cluster | Member |    Host    |  Role  |  State  | TL | Lag in MB |
+---------+--------+------------+--------+---------+----+-----------+
| 11-test |  pg1   | 10.0.3.111 | Leader | running |  1 |           |
| 11-test |  pg2   | 10.0.3.41  |        | stopped |    |   unknown |
| 11-test |  pg3   | 10.0.3.46  |        | stopped |    |   unknown |
+---------+--------+------------+--------+---------+----+-----------+
Leader election has happened and pg1 has become the primary. It created its instance with the Debian-specific pg_createcluster_patroni program that runs pg_createcluster in the background. Then the two other nodes clone from the leader using the pg_clonecluster_patroni program which sets up an instance using pg_createcluster and then runs pg_basebackup from the primary. After that, all nodes are up and running:
+---------+--------+------------+--------+---------+----+-----------+
| Cluster | Member |    Host    |  Role  |  State  | TL | Lag in MB |
+---------+--------+------------+--------+---------+----+-----------+
| 11-test |  pg1   | 10.0.3.111 | Leader | running |  1 |         0 |
| 11-test |  pg2   | 10.0.3.41  |        | running |  1 |         0 |
| 11-test |  pg3   | 10.0.3.46  |        | running |  1 |         0 |
+---------+--------+------------+--------+---------+----+-----------+
The well-known Debian postgresql-common commands work as well:
ssh pg1 'pg_lsclusters'
Ver Cluster Port Status Owner    Data directory                 Log file
11  test    5432 online postgres /var/lib/postgresql/11/test    /var/log/postgresql/postgresql-11-test.log
Failover Behaviour
If the primary is abruptly shutdown, its leader token will expire after a while and Patroni will eventually initiate failover and a new leader election:
+---------+--------+-----------+------+---------+----+-----------+
| Cluster | Member |    Host   | Role |  State  | TL | Lag in MB |
+---------+--------+-----------+------+---------+----+-----------+
| 11-test |  pg2   | 10.0.3.41 |      | running |  1 |         0 |
| 11-test |  pg3   | 10.0.3.46 |      | running |  1 |         0 |
+---------+--------+-----------+------+---------+----+-----------+
[...]
+---------+--------+-----------+--------+---------+----+-----------+
| Cluster | Member |    Host   |  Role  |  State  | TL | Lag in MB |
+---------+--------+-----------+--------+---------+----+-----------+
| 11-test |  pg2   | 10.0.3.41 | Leader | running |  2 |         0 |
| 11-test |  pg3   | 10.0.3.46 |        | running |  1 |         0 |
+---------+--------+-----------+--------+---------+----+-----------+
[...]
+---------+--------+-----------+--------+---------+----+-----------+
| Cluster | Member |    Host   |  Role  |  State  | TL | Lag in MB |
+---------+--------+-----------+--------+---------+----+-----------+
| 11-test |  pg2   | 10.0.3.41 | Leader | running |  2 |         0 |
| 11-test |  pg3   | 10.0.3.46 |        | running |  2 |         0 |
+---------+--------+-----------+--------+---------+----+-----------+
The old primary will rejoin the cluster as standby once it is restarted:
+---------+--------+------------+--------+---------+----+-----------+
| Cluster | Member |    Host    |  Role  |  State  | TL | Lag in MB |
+---------+--------+------------+--------+---------+----+-----------+
| 11-test |  pg1   | 10.0.3.111 |        | running |    |   unknown |
| 11-test |  pg2   | 10.0.3.41  | Leader | running |  2 |         0 |
| 11-test |  pg3   | 10.0.3.46  |        | running |  2 |         0 |
+---------+--------+------------+--------+---------+----+-----------+
[...]
+---------+--------+------------+--------+---------+----+-----------+
| Cluster | Member |    Host    |  Role  |  State  | TL | Lag in MB |
+---------+--------+------------+--------+---------+----+-----------+
| 11-test |  pg1   | 10.0.3.111 |        | running |  2 |         0 |
| 11-test |  pg2   | 10.0.3.41  | Leader | running |  2 |         0 |
| 11-test |  pg3   | 10.0.3.46  |        | running |  2 |         0 |
+---------+--------+------------+--------+---------+----+-----------+
If a clean rejoin is not possible due to additional transactions on the old timeline the old primary gets re-cloned from the current leader. In case the data is too large for a quick re-clone, pg_rewind can be used. In this case a password needs to be set for the postgres user and regular database connections (as opposed to replication connections) need to be allowed between the cluster nodes.
Creation of additional Instances
It is also possible to create further clusters with pg_createconfig_patroni, one can either assign a PostgreSQL port explicitly via the --port option, or let pg_createconfig_patroni assign the next free port as is known from pg_createcluster:
for i in pg1 pg2 pg3; do ssh $i 'pg_createconfig_patroni 11 test2 && systemctl start patroni@11-test2'; done
ssh pg1 'patronictl -c /etc/patroni/11-test2.yml list'
+----------+--------+-----------------+--------+---------+----+-----------+
| Cluster  | Member |       Host      |  Role  |  State  | TL | Lag in MB |
+----------+--------+-----------------+--------+---------+----+-----------+
| 11-test2 |  pg1   | 10.0.3.111:5433 | Leader | running |  1 |         0 |
| 11-test2 |  pg2   |  10.0.3.41:5433 |        | running |  1 |         0 |
| 11-test2 |  pg3   |  10.0.3.46:5433 |        | running |  1 |         0 |
+----------+--------+-----------------+--------+---------+----+-----------+
Ansible Playbook
In order to easily deploy a 3-node Patroni cluster we have created an Ansible playbook on Github. It automates the installation and configuration of PostgreSQL and Patroni on the three nodes, as well as the DCS server on a fourth node.
Questions and Help
Do you have any questions or need help? Feel free to write to info@credativ.com.
The migration of IT landscapes to cloud environments is common today. However, the question often remains how to monitor these newly created infrastructures and react to failures. For traditional infrastructure, monitoring tools such as Icinga are used. These tools are often deployed using configuration management methods, such as Ansible or Puppet.
In cloud environments, this is somewhat different. On the one hand, virtual machines are certainly used here, where these methods would be applicable. On the other hand, modern cloud environments also thrive on abstracting away from the virtual machine and offering services, for example as SaaS, in a decoupled manner. But how does one monitor such services?
Manual configuration of an Icinga2 monitoring system is not advisable, as these cloud environments, in particular, are characterized by high dynamism. The risk of not monitoring a service that was quickly added but later becomes important is high.
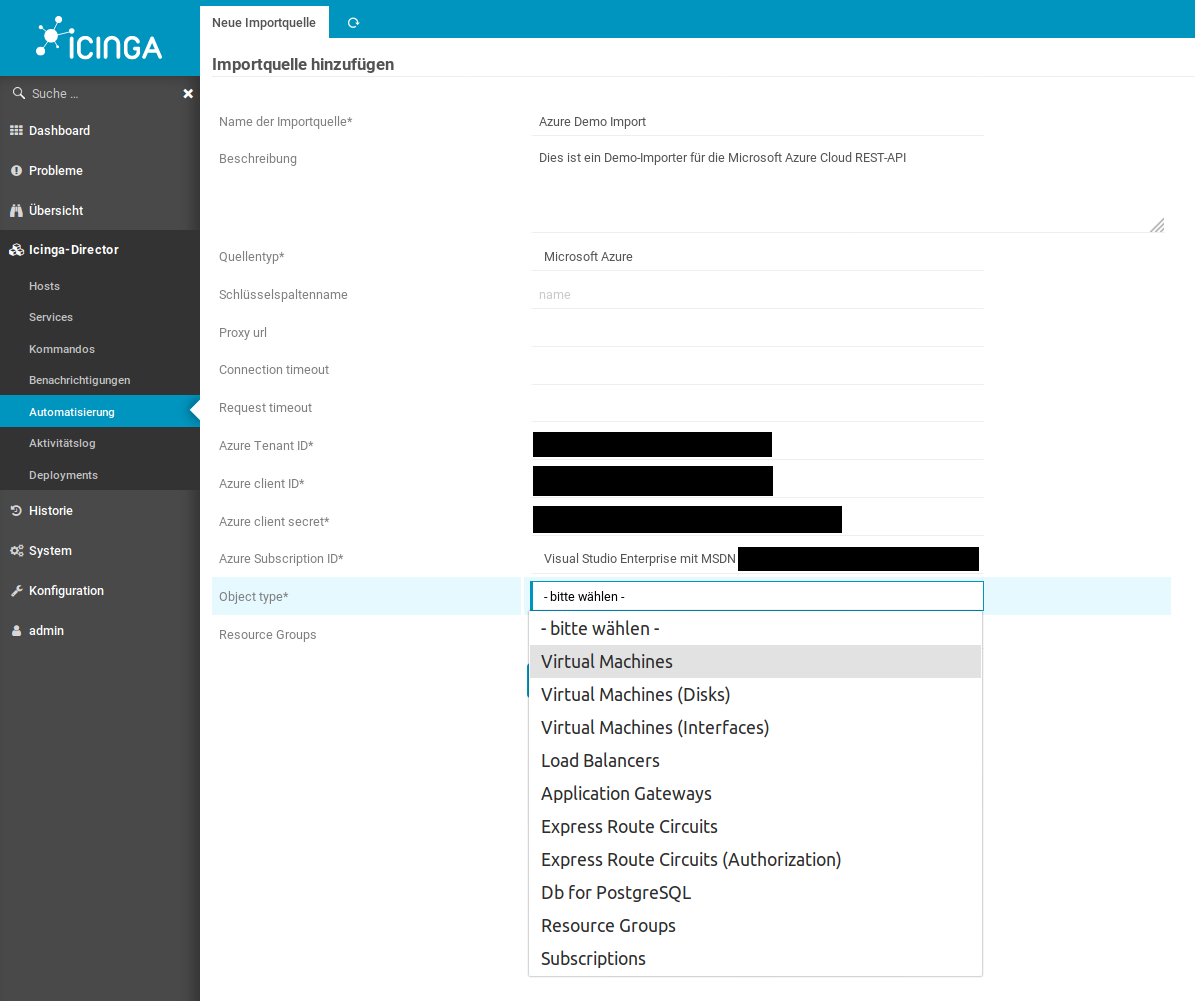
The Icinga2 and IcingaWeb2 project responded to these requirements for dynamic monitoring environments some time ago with the Director plugin. The Director plugin, using so-called importer modules, is capable of dynamically reading resources contained in various environments, such as “VMware VSphere” or “Amazon AWS“. These can then be automatically integrated into classic Icinga monitoring via rules.
Sponsored by DPD Deutschland GmbH, credativ GmbH is developing an extension module for the IcingaWeb2 Director, which allows dynamic integration of resources from the “Microsoft Azure Cloud“. This module queries the Microsoft Azure REST API and returns various resource types, which can then be automatically added to your monitoring via the Director. The module is already in use by our customers and will be further developed according to demand.
Ten resource types are already supported
Currently, the Azure Importer Module supports the following resource types:
- Virtual Machines
- Virtual Disks
- Network Interfaces for Virtual Machines
- Load Balancers
- Application Gateways
- Microsoft.DBforPostgreSQL® servers (SaaS)
- Express Route Circuits
- Authorizations for Express Route Circuits
- Resource Groups
- Subscriptions
The module is now available as an open source solution
The respective tested versions are available here for download as a release.
Do you require support with monitoring?
Key Takeaways
- The migration of IT landscapes to cloud environments requires effective monitoring.
- The Icinga Director plugin enables the automatic integration of resources from various cloud environments.
- credativ GmbH is developing an Azure Importer Module for IcingaWeb2 that dynamically registers Microsoft Azure resources.
- The module already supports ten different resource types and is available as open source under the MIT license.
- Existing customers of credativ GmbH can quickly request assistance for monitoring support.
The message broker RabbitMQ is highly popular in business environments. Our customers often use the software to bridge different systems, departments, or data pools. Similarly, a message broker like RabbitMQ can be used to absorb short-term load peaks and pass them on normalized to backend systems. Operating the Erlang-written message broker is straightforward to seamless for most system administrators. In fact, the system operates very stably in normal operation. With some of our customers, I see systems where the core component RabbitMQ operates largely maintenance-free.
This is a good thing!
Typically, a message broker is a very central component of an IT landscape, which means that unplanned downtime for such a component should be avoided at all costs. Planned downtime for such a component often requires coordination with many departments or business units and is therefore only feasible with considerable effort.
Based on Erlang/OTP, RabbitMQ provides the tools to operate durably and stably. Due to its Erlang/OTP foundation, RabbitMQ is also very easy to use in cluster operation, which can increase availability. To set up a cluster, not much more is needed than a shared secret (the so-called Erlang cookie) and appropriately configured names for the individual nodes. Service discovery systems can be used, but fundamentally, names resolvable via DNS or host files are sufficient.
RabbitMQ Concept
In RabbitMQ, producers communicate directly with an exchange. One or more queues are connected to an exchange, from which consumers, in turn, read messages. RabbitMQ, as a message broker, ensures that messages are routed according to specifications and distributed to the queues. It ensures that no message from a queue is consumed twice, and that persistent messages under its responsibility are not lost.
In cluster operation, it is irrelevant whether the queue actually resides on the node to which the producer or consumer is connected. The internal routing organizes this independently.

Queues can be persisted to disk or used exclusively “in-memory”. The latter are naturally deleted by a restart of RabbitMQ. The same applies to content within queues. These can also be delivered by the producer “in-memory” or persistently.
Furthermore, various exchange types can be configured, and priorities and Time-to-Live features can be set, which further expand the possibilities of RabbitMQ’s use.
Problem Areas in Daily SysAdmin Operations
Provided that appropriate sizing was considered when selecting the system for operating a RabbitMQ node – especially memory for the maximum message backlog to be compensated – there is little maintenance work involved in operating RabbitMQ. The system administrator may also be involved with the management and distribution of queues, etc., within RabbitMQ for organizational reasons, but this is fundamentally a task of application administration and highly use-case specific.
Avoid Split-Brain
In fact, there is little for the system administrator to consider in daily operations with RabbitMQ. For one, in cluster operation, it can happen that individual nodes need to be shut down for maintenance purposes, or that nodes have diverged due to a node failure or a network partition. If configured correctly, the latter should not occur. I will dedicate a separate article to proper cluster configuration. Here, care should be taken not to allow the default behavior for network partitioning (“split-brain“), but to choose a sensible alternative, such as “Pause-Minority”, which enables a quorum-based decision of the remaining network segments. In one of the upcoming versions, there will likely also be a Raft implementation for clusters.
Upgrades Can Pose Challenges
A problem that will eventually arise in daily operations is the question of upgrading RabbitMQ from a major or minor version to a higher one. Unfortunately, this is not straightforward and requires preparatory work and planning, especially in cluster operation. I plan to cover this topic in detail in a later blog post.
It is important to note in advance: Cluster upgrades are only possible for patch-level changes, for example, from version 3.7.1 to version 3.7.3 or similar. However, caution is advised here as well; even at patch levels, there are isolated version jumps that cannot be easily mixed within the cluster. Information on this can be found in the release notes, which should definitely be consulted beforehand.
Single-node servers can usually be easily upgraded to a more recent version while shut down. However, the notes in all release notes for the affected major, minor, and patch levels should be read. Intermediate steps may be necessary here.
For all RabbitMQ upgrades, it must also always be considered that, in addition to the message broker, the associated Erlang/OTP platform may also need to be adjusted. This is not to be expected for patch-level changes.
What can we do for you?
We would be pleased to advise you on the concept of your RabbitMQ deployment and support you in choosing whether this tool or perhaps other popular open-source systems such as Apache Kafka are suitable for you.
Should something not work or if you require support in operating these components, please let us know. We look forward to your call.
Guide: RabbitMQ Cheat Sheet
To make the work easier for the interested system administrator, I have compiled a so-called CheatSheet for RabbitMQ. This work was supported by one of our customers, who kindly gave us permission to publish it. Therefore, you can download the current copy here:
Download RabbitMQ Cheat Sheet as PDF file.
Further information on RabbitMQ can also be found here:
General Information and History of Varnish
Varnish combines the functionalities of a reverse proxy, HTTP load balancer, and cache for data delivered via HTTP.
Development started around 2006 with version 0.9 as the first release and has now reached version 5.1.
Varnish is available both as a free Community Edition (BSD license) and an Enterprise Edition with various additional features for HA, SSL, and Web GUI, for example. With fastly, there is even a CDN provider that is built entirely on Varnish.
The Community Edition cannot terminate HTTPS requests, which is why an SSL terminator such as Nginx or Caddy is required to forward requests to Varnish as HTTP requests. Naturally, an existing appliance or other available infrastructure can also be used for this purpose. There will be no SSL support in the free version, a decision which is explained in detail by Poul-Henning Kamp, one of the lead developers.
Internally, Varnish operates according to the following simplified principle (details):
- A request is accepted by varnishd and assigned an ID
- This request is forwarded to a worker thread using the current VCL
- The request is processed accordingly and sent to the backend if no cached entry is available
- The backend’s response is received by varnishd, also assigned an ID, and processed according to the VCL
- The response is then sent from varnishd to the client
Requests via HTTPS follow the path through the SSL proxy accordingly.
More on the term VCL in the corresponding section later.
Why Varnish?
There are several alternatives to Varnish, including Nginx, Apache, and HAProxy. As usual, personal requirements, preferences, and, of course, expertise are the deciding factors.
However, Varnish is specialized in its field and offers several features that are difficult to implement in the alternatives.
Examples include the seamless switching of configurations at runtime (in both directions), extensive debugging options in the request flow, and flexible configuration via VCL.
Configuring a large number of redirects or URL manipulations in Nginx, for instance, can quickly become confusing and may only be maintainable with the appropriate expertise.
Ultimately, as is so often the case, the project requirements and respective possibilities must be examined in advance.
Installation
Varnish is included in a specific version in the repositories of most Linux distributions.
An overview of the available versions for manual installation can be found here.
More detailed explanations regarding installation can be found here
Configuration
Varnish consists of several components, which must also be configured separately.
varnishd
The daemon that receives and processes requests. The general configuration of the daemon is handled either within the systemd service file or in a separate file, such as /etc/defaults/varnish. This is where settings like the number of worker threads, RAM limits, or daemon ports are configured.
VCL (Request Processing)
The processing of requests or the configuration of backends and their health checks are performed in a separate configuration. This is a VCL file (initially default.vcl, which is loaded when the service starts, e.g., under /etc/varnish/default.vcl). VCL is a Varnish-internal scripting language that describes to the service how to handle requests. This is automatically compiled into C code upon loading and made available to the varnishd daemon. It can also be changed or completely replaced at runtime.
Varnishncsa
The logging daemon for Varnish, similar to a web server’s access log. This runs independently of varnishd and must therefore be started separately. Configuration is performed either in the corresponding systemd service file or a separate file such as /etc/defaults/varnishncsa. The log format can also be adjusted to match the familiar Apache format, for example.
VCL
VCL (Varnish Configuration Language) is a Varnish-internal language used to control request handling.
This is defined in several sub-functions with the vcl_ prefix (built-ins).
You can, of course, add your own functions to the configuration, but these must be called within the corresponding built-ins.
Some configurations, such as the definition of backends, take place outside of the built-ins. More on this in the example below.
A complete VCL reference can be found here, along with a detailed description of the built-ins here.
A VCL configuration can be very extensive. Instead of including and commenting on it in its entirety here, please refer to
the example VCL by Matthias Geniar.
The configuration listed there includes basic entries such as backend and ACL definitions, as well as several additional functions and request manipulations (WebSocket support, URI manipulation, ESI, and more). Of course, this is only a general configuration. For production purposes, you should check which requirements are needed and how they are to be met.
Not included in that example, but a common configuration: If Nginx is used as an SSL terminator, it can simultaneously function as an emergency backend to deliver a general maintenance page, for instance, should none of the regular backends be available. This would prevent error messages from being displayed to visitors.
VMODs
Varnish offers the possibility to integrate custom C code within the VCL. However, this is very cumbersome, which is why VMODs exist. These are additional modules implemented in C that can extend the functions of Varnish or its VCL.
Varnish provides some standard modules, such as std or director, directly with the installation, but there are also many already published modules that extend functionality.
A list of the most common modules can be found here.
At this point, it is important to ensure that these are compatible with the installed Varnish version. Some of the most popular ones are likely GeoIP and BasicAuth.
A description of how to implement your own VMODs can be found here
CLI and other Binaries
The following is an overview of the most common binaries delivered with the Varnish package that simplify administration and/or debugging.
An interactive CLI that allows you to jump into a running Varnish instance to, for example, load new VCLs, get an overview of the storages used, view the varnishd configuration, or stop the instance. The CLI can also be used as a “one-shot command” to check a new VCL for compatibility. To do this, simply run “varnishd -C -f /etc/varnishd/default.vcl” (or the path to the file to be checked). If there are no problems, the VCL translated into C code is output; otherwise, a corresponding error message is displayed.
This way, you can always ensure whether the new configuration works at all. Functional errors are, of course, not checked here.
Varnishlog is a very powerful tool that allows you to view the current request flow from Varnish in real time. Since a large amount of data can be generated here, it is recommended to call varnishlog manually only for debugging purposes. It lists all request headers, timestamps, Varnish function calls, and methods. This makes it very easy to examine a specific request through its entire path from reception to the sending of the response.
Below are a few examples of commands:
- Logs all requests for the Host header example.com
varnishlog -q ‘ReqHeader ~ “Host: example.com”‘ - Logs the URL and referer for all requests where the Host header matches (www\.)?example\.com.
varnishlog -q ‘ReqHeader ~ “Host: (www\.)?example\.com”‘ -i “ReqURL” -I “ReqHeader:Referer:”
Displays all important internal data of the corresponding Varnish instance in a top-like overview. This includes, for example, the total number of requests since startup, backend availability over the last few minutes, cache hits/misses, and much more. There is also a one-shot function that outputs a snapshot of the data, which can be used for monitoring purposes.
This is a top-like overview of the varnishlog. It displays the entries most frequently appearing in the log in descending order of occurrence.
An example:
3.00 ReqHeader Cookie:
3.00 ReqUnset Cookie:
0.75 ReqURL /
0.75 BerespProtocol HTTP/1.1
0.75 VCL_return fetch
0.75 VCL_return deliver
0.75 ReqHeader Host: localhost
Further Topics
The possibilities with Varnish are very diverse, and covering them all in one article would exceed the scope. If you have any questions or requests regarding specific topics that should be explored in more depth in an article, please leave them in the comments.
VXLAN stands for “Virtual eXtensible Local Area Network”. Standardized in RFC 7348 in August 2014, VXLAN is also available today as a virtual network interface in current Linux kernels. But what is VXLAN?
What is VXLAN?
When one reads the keywords “Virtual” and “LAN”, most rightly think of VLAN. Here, a large physical network is logically divided into smaller networks. For this purpose, the corresponding connections are marked with VLAN tags. This can be done either at the sending host (tagged VLAN) or, for example, by the switch (port-based VLAN). These markings are already made at Layer 2, the Data Link Layer in the OSI model. This allows them to be effectively evaluated at a very low network level, thereby suppressing unwanted communication in the network. The IEEE 802.1Q standard defines a 12-bit width for the VLAN tag, thus fundamentally resulting in 4096 possible VLAN networks on an Ethernet installation.
VXLAN was developed to circumvent this limitation. With VXLAN, a transmission technology based on OSI Layer 3 or Layer 4 is introduced, which creates virtual Layer 2 environments. With VXLAN logic, approximately 16 million (2 to the power of 24) VXLAN Layer 2 networks are possible, which in turn can map 4096 VLAN network segments. This should initially be sufficient even for very large Ethernet installations.
How can one set up such a VXLAN?
A VXLAN interface can then be set up, for example, with
ip link add vxlan0 type vxlan id 42 group 239.1.1.1 dev eth0
available. This command creates the device “vxlan0” as a VXLAN with ID 42 on the physical interface “eth0”. Multiple VXLANs are distinguished based on their ID. The instruction “group
Using the command line
ip addr add 10.0.0.1/24 dev vxlan0
one assigns a fixed IP address to the newly created VXLAN network interface, here in the example 10.0.0.1
The command
ip link set up dev vxlan0
activates the newly created network interface “vxlan0”. This creates a virtual network based on IP multicast on the physical interface “eth0”.
The interface “vxlan0” now behaves in principle exactly like an Ethernet interface. All other computers that select VXLAN ID 42 and multicast group 239.1.1.1 will thus become part of this virtual Ethernet. On this, one could now again set up various VLANs, for example, with
ip link add link vxlan0 name vlan1 type vlan id 1
set up a new VLAN on the VXLAN interface. In this case, one would not need to assign an IP address to the VXLAN interface.
What are its practical applications?
Fundamentally, VXLAN is suitable for use cases in very large Ethernets, such as in cloud environments, to overcome the 4096 VLAN limit.
Use as a Test Environment for Network Services
Alternatively, VXLAN can be very effectively used in test environments or virtualized environments where full control over the Layer 2 network to be used is required. If one wishes to test network infrastructure components or their configuration, such a completely isolated network is ideal. This also allows one to bypass control structures introduced by virtualization environments, which are particularly obstructive for such tests. My first practical experience with VXLAN was during the testing of a more complex DHCP setup on several virtual machines in OpenStack. On the network interfaces provided by OpenStack, the test was impossible for me, as I had only limited access to the network configurations on the virtualization host side, and OpenStack filters out DHCP packets from the network stream. This problem could be elegantly circumvented by setting up the test network on VXLAN. At the same time, this ensured that the DHCP test had no impact on other parts of the OpenStack network. Furthermore, the Ethernet connection provided by OpenStack remained permanently usable for maintenance and monitoring purposes.
For example, in unicast operation, scenarios are also conceivable where a Layer 2 network spanned over VXLAN is transported across multiple locations. There are switches or routers that support VXLAN and can serve as VTEPs (VXLAN Tunnel Endpoints). These can be used, for example, to connect two multicast VXLAN networks via unicast between the VTEPs, thereby transparently spanning a large VXLAN.
Is VXLAN secure?
VXLAN adds another Layer 2 infrastructure on top of an existing Ethernet infrastructure. This operates with UDP packets in unicast or multicast. Encryption at the VXLAN level is not provided and would need to be handled by higher protocol layers if required. IPSec solutions or, for example, TLS are options here. Fundamentally, VXLAN is at a comparable security level to most other Layer 2 network protocols.
Possible Issues?
With VXLAN, users may encounter a “familiar acquaintance” in the form of MTU issues. A standard Ethernet frame has a length of 1,518 bytes. After deducting the Ethernet header, 1,500 bytes remain for payload. VXLAN extends the Ethernet header by 50 bytes, which reduces the available payload to 1,450 bytes. This should be considered when setting the MTU. So-called Jumbo Frames are affected accordingly. Here, the additional 50 bytes must also be taken into account.
What does credativ offer?
We are pleased to support and advise you on the design and operation of your network environment. Among other things, we work in the areas of DevOps, network infrastructure, and network design. credativ GmbH has employees with expertise in highly complex network setups for data centers on real hardware as well as in virtual environments. Our focus is on implementation with open-source software.
Introduction
Today, there is no need to argue why centralized logging is useful or even necessary. Most medium-sized companies now have centralized logging or are currently implementing it.
Once the infrastructure is in place, it is important to use it effectively and efficiently! Especially as an infrastructure operator or service provider, the goal is to optimally support different stakeholders with different requirements. For example, the development department should have continuous access to all logs from their test systems. However, from production, perhaps only all error messages are needed in real time, but more upon request.
Such models can be easily implemented and tested with graylog® or Kibana®. Classification and analysis may work well and efficiently in test operations or small environments with PostgreSQL® default settings. However, when operating a large number of databases or retaining logs for extended periods, usage can quickly become difficult.
Problem Statement
Log entries are centrally captured and can in principle be used. In practice, however, it is difficult to impossible to extract all relevant information in a timely manner. Searching for specific entries requires full-text searches with wildcards, which is no longer practical with large data volumes.
For example, if you want to grant specific groups access exclusively to logs that meet certain functional criteria, such as database name, error_severity, or similar, this must be implemented through full-text search and error-prone filters.
If a DBA wants to see all messages from a specific user, a specific query, or a session, this requires particularly complex indexing for wildcard searches. Alternatively, such queries are very slow and cannot be answered immediately.
| Starting Point: | Centralized logging has already been implemented, e.g., ELK Stack or graylog®. |
| Goal: | We want to capture PostgreSQL® log messages semantically and thereby efficiently: classify, group, and analyze them. |
Alternative
The alternative is to capture log messages semantically and store the individual fields in an appropriate data structure.
If the normal stderr log is used, parsing becomes difficult to impossible, as the individual fields cannot be identified. However, PostgreSQL® also offers the option to produce log messages in CSV format (csvlog). This outputs all fields comma-separated.
Excursus: The idea is not new. For a long time, some DBAs have been loading their logs directly back into a PostgreSQL® table. This allows them to search and process the logs with SQL and all familiar built-in tools. DBAs are usually very satisfied with this construct, but it represents an isolated solution. Example table for PostgreSQL® 9.5: CREATE TABLE postgres_log ( log_time timestamp(3) with time zone, user_name text, database_name text, process_id integer, connection_from text, session_id text, session_line_num bigint, command_tag text, session_start_time timestamp with time zone, virtual_transaction_id text, transaction_id bigint, error_severity text, sql_state_code text, message text, detail text, hint text, internal_query text, internal_query_pos integer, context text, query text, query_pos integer, location text, application_name text, PRIMARY KEY (session_id, session_line_num) ); |
Structure
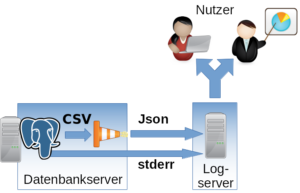
Implementation
The csvlog can serve as the basis for efficiently populating a centralized logging system. To keep further processing as simple as possible and to avoid committing to a specific logging system, we translate the log from CSV to JSON. It can then be fed in as desired. In the following example, TCP is used.
To change the log format, the following options must be adjusted in PostgreSQL®:
#------------------------------------------------------------------------------
# ERROR REPORTING AND LOGGING
#------------------------------------------------------------------------------

# - Where to Log -

log_destination = 'csvlog' # Valid values are combinations of
  # stderr, csvlog, syslog, and eventlog,
  # depending on platform. csvlog
  # requires logging_collector to be on.

# This is used when logging to stderr:
logging_collector = on # Enable capturing of stderr and csvlog
  # into log files. Required to be on for
  # csvlogs.
  # (change requires restart)
  # These are only used if logging_collector is on:
log_directory = '/var/log/postgresql' # directory where log files are written,
  # can be absolute or relative to PGDATA
For parsing and translating to JSON as well as delivering to the logging system, we use logstash® with the following configuration as a Jinja2 template:
input {
  file {
  "path" =>  "/var/log/postgresql/*.csv"
  "sincedb_path" =>  "/tmp/sincedb_pgsql"
  # fix up multiple lines in log output into one entry
  codec =>  multiline {
  pattern =>  "^%{TIMESTAMP_ISO8601}.*"
  what =>  previous
  negate =>  true
  }
  }
}

# Filter is tested for PostgreSQL®  9.5
filter {
  csv {
  columns =>  [ "pg_log_time", "pg_user_name", "pg_database_name",
  "pg_process_id", "pg_connection_from", "pg_session_id",
  "pg_session_line_num", "pg_command_tag",
  "pg_session_start_time", "pg_virtual_transaction_id",
  "pg_transaction_id", "pg_error_severity", "pg_sql_state_code",
  "pg_sql_message", "pg_detail", "pg_hint", "pg_internal_query",
  "pg_internal_query_pos", "pg_context", "pg_query",
  "pg_query_pos", "pg_location", "pg_application_name" ]
  }

  date {
  #2014-05-22 17:02:35.069 CDT
  match =>  ["log_time", "YYYY-MM-dd HH:mm:ss.SSS z"]
  }

  mutate {
  add_field =>  {
  "application_name" =>  "postgres"
  }
  }

}

output {
  tcp {
  host =>  "{{ log_server }}"
  port =>  {{ log_port }}
  codec =>  "json_lines"
  }
}
It is important that the filter for translating the CSV fields is adapted to the PostgreSQL® major version being used. The fields can differ from version to version. In most cases, new fields are added.
Also note that logstash® has difficulty recognizing the timestamp independently. The specific format should be specified (time zone).
The following variables must be set:
| {{ log_server }} | Log server, in our case a graylog® |
| {{ log_port }} | Port on the log server |
Configured this way, log files can be efficiently classified and searched. Permissions are also easier to manage.
- Permission at database level => pg_database_name
- Severity => pg_error_severity
- Permission for logs from specific hosts => pg_connection_from
- Permission for logs from specific applications => pg_application_name
Important: The normal stderr log should in any case still be included in centralized logging. After startup, no normal operational messages from PostgreSQL® will appear here, but error outputs from involved processes will. For example, the stderr output of a failed archive command can be found here. This information is essential for administration.
We already support numerous customers in operating the described procedure in production. If you have questions about this topic or need support, please feel free to contact our PostgreSQL® Competence Center.
This article was originally written by Alexander Sosna.